Flexistipes sinusarabici (strain ATCC 49648 / DSM 4947 / MAS 10)
Taxonomy: cellular organisms; Bacteria; Deferribacteres; Deferribacteres; Deferribacterales; Deferribacteraceae; Flexistipes; Flexistipes sinusarabici
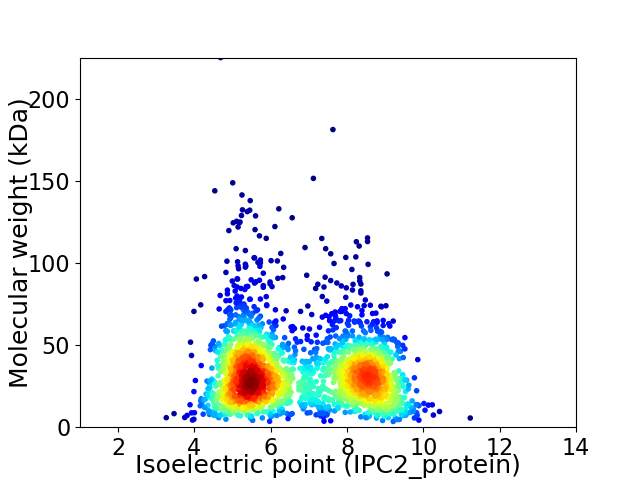
Average proteome isoelectric point is 6.75
Get precalculated fractions of proteins

Virtual 2D-PAGE plot for 2185 proteins (isoelectric point calculated using IPC2_protein)
Get csv file with sequences according to given criteria:
* You can choose from 21 different methods for calculating isoelectric point
Summary statistics related to proteome-wise predictions


Protein with the lowest isoelectric point:
>tr|F8E9I1|F8E9I1_FLESM Uncharacterized protein OS=Flexistipes sinusarabici (strain ATCC 49648 / DSM 4947 / MAS 10) OX=717231 GN=Flexsi_1662 PE=4 SV=1
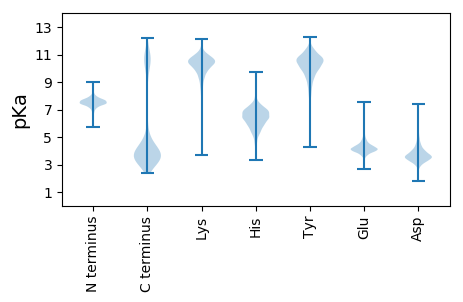
MM1 pKa = 7.36KK2 pKa = 10.39RR3 pKa = 11.84FILGLFIIPFVDD15 pKa = 3.19ACGGSVSDD23 pKa = 4.57GNSGSSFEE31 pKa = 4.15SARR34 pKa = 11.84VYY36 pKa = 11.1VSGSSIEE43 pKa = 4.12GGAYY47 pKa = 10.32DD48 pKa = 4.97ADD50 pKa = 4.16SVDD53 pKa = 4.5KK54 pKa = 11.47GSGSCDD60 pKa = 2.9NVSNYY65 pKa = 8.92TFTPDD70 pKa = 4.91DD71 pKa = 3.03ITVNVKK77 pKa = 10.35SEE79 pKa = 4.22ALPNLPSDD87 pKa = 4.11LEE89 pKa = 4.08LAEE92 pKa = 4.15VEE94 pKa = 4.56VYY96 pKa = 10.55KK97 pKa = 10.06ITVSFTPNDD106 pKa = 4.53DD107 pKa = 3.37ISPEE111 pKa = 4.08LSTKK115 pKa = 9.83EE116 pKa = 4.2YY117 pKa = 10.61YY118 pKa = 9.24PVSYY122 pKa = 9.97IIEE125 pKa = 4.45PNSTKK130 pKa = 10.52NIPVRR135 pKa = 11.84IIDD138 pKa = 4.49RR139 pKa = 11.84IEE141 pKa = 4.05KK142 pKa = 10.0VDD144 pKa = 3.9NEE146 pKa = 4.35SPLYY150 pKa = 10.76FFDD153 pKa = 4.93NLGKK157 pKa = 10.38EE158 pKa = 4.14YY159 pKa = 10.58NYY161 pKa = 10.13TVNIEE166 pKa = 4.4FKK168 pKa = 10.93AEE170 pKa = 3.7EE171 pKa = 4.25LLYY174 pKa = 11.1GGTDD178 pKa = 3.1SLSYY182 pKa = 10.71SFQLRR187 pKa = 11.84YY188 pKa = 9.5FDD190 pKa = 5.47EE191 pKa = 5.61VDD193 pKa = 3.36DD194 pKa = 4.24CTT196 pKa = 4.59
MM1 pKa = 7.36KK2 pKa = 10.39RR3 pKa = 11.84FILGLFIIPFVDD15 pKa = 3.19ACGGSVSDD23 pKa = 4.57GNSGSSFEE31 pKa = 4.15SARR34 pKa = 11.84VYY36 pKa = 11.1VSGSSIEE43 pKa = 4.12GGAYY47 pKa = 10.32DD48 pKa = 4.97ADD50 pKa = 4.16SVDD53 pKa = 4.5KK54 pKa = 11.47GSGSCDD60 pKa = 2.9NVSNYY65 pKa = 8.92TFTPDD70 pKa = 4.91DD71 pKa = 3.03ITVNVKK77 pKa = 10.35SEE79 pKa = 4.22ALPNLPSDD87 pKa = 4.11LEE89 pKa = 4.08LAEE92 pKa = 4.15VEE94 pKa = 4.56VYY96 pKa = 10.55KK97 pKa = 10.06ITVSFTPNDD106 pKa = 4.53DD107 pKa = 3.37ISPEE111 pKa = 4.08LSTKK115 pKa = 9.83EE116 pKa = 4.2YY117 pKa = 10.61YY118 pKa = 9.24PVSYY122 pKa = 9.97IIEE125 pKa = 4.45PNSTKK130 pKa = 10.52NIPVRR135 pKa = 11.84IIDD138 pKa = 4.49RR139 pKa = 11.84IEE141 pKa = 4.05KK142 pKa = 10.0VDD144 pKa = 3.9NEE146 pKa = 4.35SPLYY150 pKa = 10.76FFDD153 pKa = 4.93NLGKK157 pKa = 10.38EE158 pKa = 4.14YY159 pKa = 10.58NYY161 pKa = 10.13TVNIEE166 pKa = 4.4FKK168 pKa = 10.93AEE170 pKa = 3.7EE171 pKa = 4.25LLYY174 pKa = 11.1GGTDD178 pKa = 3.1SLSYY182 pKa = 10.71SFQLRR187 pKa = 11.84YY188 pKa = 9.5FDD190 pKa = 5.47EE191 pKa = 5.61VDD193 pKa = 3.36DD194 pKa = 4.24CTT196 pKa = 4.59
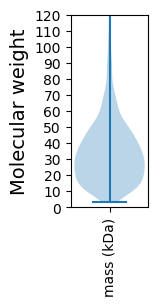
Molecular weight: 21.72 kDa
Isoelectric point according different methods:
Protein with the highest isoelectric point:
>tr|F8E5M1|F8E5M1_FLESM Phosphotransferase system phosphocarrier protein HPr OS=Flexistipes sinusarabici (strain ATCC 49648 / DSM 4947 / MAS 10) OX=717231 GN=Flexsi_0993 PE=4 SV=1
MM1 pKa = 7.08SQIRR5 pKa = 11.84TMKK8 pKa = 10.47KK9 pKa = 6.99PTNIKK14 pKa = 9.95KK15 pKa = 9.89KK16 pKa = 9.41RR17 pKa = 11.84KK18 pKa = 7.69QGFRR22 pKa = 11.84ARR24 pKa = 11.84MKK26 pKa = 10.11TRR28 pKa = 11.84GGKK31 pKa = 9.0QVLSRR36 pKa = 11.84RR37 pKa = 11.84RR38 pKa = 11.84AKK40 pKa = 9.98GRR42 pKa = 11.84KK43 pKa = 8.8RR44 pKa = 11.84LAII47 pKa = 4.0
MM1 pKa = 7.08SQIRR5 pKa = 11.84TMKK8 pKa = 10.47KK9 pKa = 6.99PTNIKK14 pKa = 9.95KK15 pKa = 9.89KK16 pKa = 9.41RR17 pKa = 11.84KK18 pKa = 7.69QGFRR22 pKa = 11.84ARR24 pKa = 11.84MKK26 pKa = 10.11TRR28 pKa = 11.84GGKK31 pKa = 9.0QVLSRR36 pKa = 11.84RR37 pKa = 11.84RR38 pKa = 11.84AKK40 pKa = 9.98GRR42 pKa = 11.84KK43 pKa = 8.8RR44 pKa = 11.84LAII47 pKa = 4.0
Molecular weight: 5.58 kDa
Isoelectric point according different methods:
Peptides (in silico digests for buttom-up proteomics)
Below you can find in silico digests of the whole proteome with Trypsin, Chymotrypsin, Trypsin+LysC, LysN, ArgC proteases suitable for different mass spec machines.| Try ESI |
 |
|---|
| ChTry ESI |
 |
|---|
| ArgC ESI |
 |
|---|
| LysN ESI |
 |
|---|
| TryLysC ESI |
 |
|---|
| Try MALDI |
 |
|---|
| ChTry MALDI |
 |
|---|
| ArgC MALDI |
 |
|---|
| LysN MALDI |
 |
|---|
| TryLysC MALDI |
 |
|---|
| Try LTQ |
 |
|---|
| ChTry LTQ |
 |
|---|
| ArgC LTQ |
 |
|---|
| LysN LTQ |
 |
|---|
| TryLysC LTQ |
 |
|---|
| Try MSlow |
 |
|---|
| ChTry MSlow |
 |
|---|
| ArgC MSlow |
 |
|---|
| LysN MSlow |
 |
|---|
| TryLysC MSlow |
 |
|---|
| Try MShigh |
 |
|---|
| ChTry MShigh |
 |
|---|
| ArgC MShigh |
 |
|---|
| LysN MShigh |
 |
|---|
| TryLysC MShigh |
 |
|---|
General Statistics
Number of major isoforms |
Number of additional isoforms |
Number of all proteins |
Number of amino acids |
Min. Seq. Length |
Max. Seq. Length |
Avg. Seq. Length |
Avg. Mol. Weight |
|---|---|---|---|---|---|---|---|
0 |
690808 |
32 |
2009 |
316.2 |
35.73 |
Amino acid frequency
Ala |
Cys |
Asp |
Glu |
Phe |
Gly |
His |
Ile |
Lys |
Leu |
|---|---|---|---|---|---|---|---|---|---|
6.13 ± 0.044 | 1.109 ± 0.024 |
5.629 ± 0.041 | 7.241 ± 0.051 |
5.281 ± 0.049 | 6.592 ± 0.048 |
1.672 ± 0.022 | 8.342 ± 0.052 |
8.659 ± 0.05 | 9.199 ± 0.047 |
Met |
Asn |
Gln |
Pro |
Arg |
Ser |
Thr |
Val |
Trp |
Tyr |
|---|---|---|---|---|---|---|---|---|---|
2.5 ± 0.024 | 5.374 ± 0.045 |
3.247 ± 0.025 | 2.364 ± 0.021 |
3.951 ± 0.036 | 6.546 ± 0.039 |
4.665 ± 0.03 | 6.666 ± 0.043 |
0.707 ± 0.014 | 4.126 ± 0.034 |
Most of the basic statistics you can see at this page can be downloaded from this CSV file
Proteome-pI is available under Creative Commons Attribution-NoDerivs license, for more details see here
| Reference: Kozlowski LP. Proteome-pI 2.0: Proteome Isoelectric Point Database Update. Nucleic Acids Res. 2021, doi: 10.1093/nar/gkab944 | Contact: Lukasz P. Kozlowski |
