Kurlavirus BKC-1
Taxonomy: Viruses; Varidnaviria; Bamfordvirae; Nucleocytoviricota; Megaviricetes; Pimascovirales; Marseilleviridae; Marseillevirus; unclassified Marseillevirus
Average proteome isoelectric point is 6.91
Get precalculated fractions of proteins

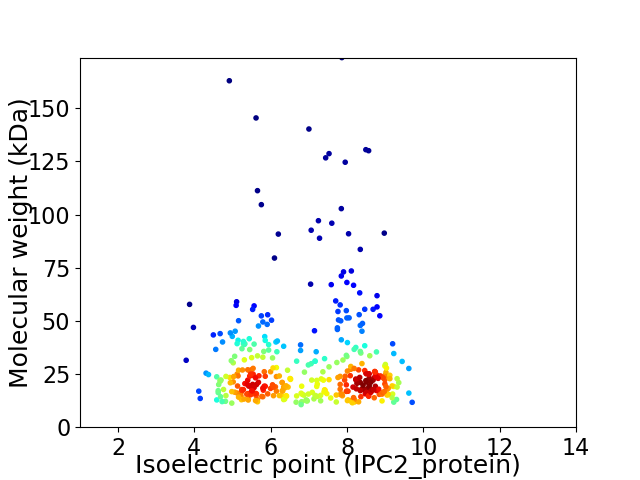
Virtual 2D-PAGE plot for 386 proteins (isoelectric point calculated using IPC2_protein)
Get csv file with sequences according to given criteria:
* You can choose from 21 different methods for calculating isoelectric point
Summary statistics related to proteome-wise predictions


Protein with the lowest isoelectric point:
>tr|A0A1S5XYX3|A0A1S5XYX3_9VIRU Putative glycosyltransferase OS=Kurlavirus BKC-1 OX=1958810 PE=4 SV=1
MM1 pKa = 7.49SRR3 pKa = 11.84LQGFFKK9 pKa = 10.51DD10 pKa = 3.47IPIVGSYY17 pKa = 10.72SVLPPVLPRR26 pKa = 11.84GSLVFLTSDD35 pKa = 3.2GNLYY39 pKa = 10.37VSNGEE44 pKa = 4.0TWNATGGDD52 pKa = 3.95IGPLAAQVAQNTADD66 pKa = 3.29IGVLQTDD73 pKa = 3.92VSTLQGEE80 pKa = 4.82VATNTLDD87 pKa = 3.32IGTLQTQVATNTSDD101 pKa = 2.88IGTLQTQVAGNSTNISALQTDD122 pKa = 4.27VSTLQGQVATNTTDD136 pKa = 2.67IGTLQSQVATNTTNIQQNSNDD157 pKa = 2.97ITNIIVAQSQGFTIADD173 pKa = 3.47NAQLRR178 pKa = 11.84TYY180 pKa = 8.03TQTIARR186 pKa = 11.84VDD188 pKa = 3.72VASTSPTVIYY198 pKa = 9.38TLNIPLTSNINAVYY212 pKa = 10.05LIQWNVLAHH221 pKa = 5.23YY222 pKa = 7.54QTANVYY228 pKa = 9.95SAVGQSSVLSNGVGSLVSVFGTTTDD253 pKa = 3.5QTNSGSATIAVTSDD267 pKa = 2.97FSTPVFRR274 pKa = 11.84LIVTSDD280 pKa = 3.23SAVITTYY287 pKa = 10.32SGYY290 pKa = 11.17VIVTNILNISPP301 pKa = 4.0
MM1 pKa = 7.49SRR3 pKa = 11.84LQGFFKK9 pKa = 10.51DD10 pKa = 3.47IPIVGSYY17 pKa = 10.72SVLPPVLPRR26 pKa = 11.84GSLVFLTSDD35 pKa = 3.2GNLYY39 pKa = 10.37VSNGEE44 pKa = 4.0TWNATGGDD52 pKa = 3.95IGPLAAQVAQNTADD66 pKa = 3.29IGVLQTDD73 pKa = 3.92VSTLQGEE80 pKa = 4.82VATNTLDD87 pKa = 3.32IGTLQTQVATNTSDD101 pKa = 2.88IGTLQTQVAGNSTNISALQTDD122 pKa = 4.27VSTLQGQVATNTTDD136 pKa = 2.67IGTLQSQVATNTTNIQQNSNDD157 pKa = 2.97ITNIIVAQSQGFTIADD173 pKa = 3.47NAQLRR178 pKa = 11.84TYY180 pKa = 8.03TQTIARR186 pKa = 11.84VDD188 pKa = 3.72VASTSPTVIYY198 pKa = 9.38TLNIPLTSNINAVYY212 pKa = 10.05LIQWNVLAHH221 pKa = 5.23YY222 pKa = 7.54QTANVYY228 pKa = 9.95SAVGQSSVLSNGVGSLVSVFGTTTDD253 pKa = 3.5QTNSGSATIAVTSDD267 pKa = 2.97FSTPVFRR274 pKa = 11.84LIVTSDD280 pKa = 3.23SAVITTYY287 pKa = 10.32SGYY290 pKa = 11.17VIVTNILNISPP301 pKa = 4.0
Molecular weight: 31.48 kDa
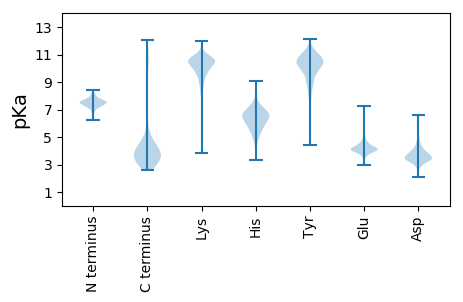
Isoelectric point according different methods:
Protein with the highest isoelectric point:
>tr|A0A1S5XYL0|A0A1S5XYL0_9VIRU DUF5858 domain-containing protein OS=Kurlavirus BKC-1 OX=1958810 PE=4 SV=1
MM1 pKa = 6.64QQRR4 pKa = 11.84LVNPEE9 pKa = 3.62TGRR12 pKa = 11.84NILYY16 pKa = 10.34GGKK19 pKa = 7.29THH21 pKa = 7.2LNLVRR26 pKa = 11.84RR27 pKa = 11.84GILPKK32 pKa = 10.57EE33 pKa = 3.98EE34 pKa = 4.08PAKK37 pKa = 10.67KK38 pKa = 10.17GAGGSNVKK46 pKa = 10.07KK47 pKa = 10.51YY48 pKa = 10.62KK49 pKa = 10.1KK50 pKa = 9.2EE51 pKa = 3.8HH52 pKa = 6.36LPASDD57 pKa = 3.38FCGTVPGSFPVNTEE71 pKa = 3.4RR72 pKa = 11.84RR73 pKa = 11.84AKK75 pKa = 10.48AALSYY80 pKa = 10.95ARR82 pKa = 11.84NDD84 pKa = 3.41VNPEE88 pKa = 3.76RR89 pKa = 11.84VRR91 pKa = 11.84EE92 pKa = 4.01CARR95 pKa = 11.84RR96 pKa = 11.84KK97 pKa = 8.83AKK99 pKa = 10.52RR100 pKa = 11.84MGWFF104 pKa = 3.21
MM1 pKa = 6.64QQRR4 pKa = 11.84LVNPEE9 pKa = 3.62TGRR12 pKa = 11.84NILYY16 pKa = 10.34GGKK19 pKa = 7.29THH21 pKa = 7.2LNLVRR26 pKa = 11.84RR27 pKa = 11.84GILPKK32 pKa = 10.57EE33 pKa = 3.98EE34 pKa = 4.08PAKK37 pKa = 10.67KK38 pKa = 10.17GAGGSNVKK46 pKa = 10.07KK47 pKa = 10.51YY48 pKa = 10.62KK49 pKa = 10.1KK50 pKa = 9.2EE51 pKa = 3.8HH52 pKa = 6.36LPASDD57 pKa = 3.38FCGTVPGSFPVNTEE71 pKa = 3.4RR72 pKa = 11.84RR73 pKa = 11.84AKK75 pKa = 10.48AALSYY80 pKa = 10.95ARR82 pKa = 11.84NDD84 pKa = 3.41VNPEE88 pKa = 3.76RR89 pKa = 11.84VRR91 pKa = 11.84EE92 pKa = 4.01CARR95 pKa = 11.84RR96 pKa = 11.84KK97 pKa = 8.83AKK99 pKa = 10.52RR100 pKa = 11.84MGWFF104 pKa = 3.21
Molecular weight: 11.71 kDa
Isoelectric point according different methods:
Peptides (in silico digests for buttom-up proteomics)
Below you can find in silico digests of the whole proteome with Trypsin, Chymotrypsin, Trypsin+LysC, LysN, ArgC proteases suitable for different mass spec machines.| Try ESI |
 |
|---|
| ChTry ESI |
 |
|---|
| ArgC ESI |
 |
|---|
| LysN ESI |
 |
|---|
| TryLysC ESI |
 |
|---|
| Try MALDI |
 |
|---|
| ChTry MALDI |
 |
|---|
| ArgC MALDI |
 |
|---|
| LysN MALDI |
 |
|---|
| TryLysC MALDI |
 |
|---|
| Try LTQ |
 |
|---|
| ChTry LTQ |
 |
|---|
| ArgC LTQ |
 |
|---|
| LysN LTQ |
 |
|---|
| TryLysC LTQ |
 |
|---|
| Try MSlow |
 |
|---|
| ChTry MSlow |
 |
|---|
| ArgC MSlow |
 |
|---|
| LysN MSlow |
 |
|---|
| TryLysC MSlow |
 |
|---|
| Try MShigh |
 |
|---|
| ChTry MShigh |
 |
|---|
| ArgC MShigh |
 |
|---|
| LysN MShigh |
 |
|---|
| TryLysC MShigh |
 |
|---|
General Statistics
Number of major isoforms |
Number of additional isoforms |
Number of all proteins |
Number of amino acids |
Min. Seq. Length |
Max. Seq. Length |
Avg. Seq. Length |
Avg. Mol. Weight |
|---|---|---|---|---|---|---|---|
0 |
104158 |
99 |
1525 |
269.8 |
30.8 |
Amino acid frequency
Ala |
Cys |
Asp |
Glu |
Phe |
Gly |
His |
Ile |
Lys |
Leu |
|---|---|---|---|---|---|---|---|---|---|
5.201 ± 0.12 | 2.567 ± 0.115 |
4.854 ± 0.078 | 8.378 ± 0.185 |
5.685 ± 0.11 | 6.194 ± 0.118 |
1.768 ± 0.058 | 5.038 ± 0.075 |
8.866 ± 0.179 | 8.658 ± 0.143 |
Met |
Asn |
Gln |
Pro |
Arg |
Ser |
Thr |
Val |
Trp |
Tyr |
|---|---|---|---|---|---|---|---|---|---|
1.953 ± 0.055 | 4.195 ± 0.099 |
3.933 ± 0.098 | 3.392 ± 0.1 |
5.318 ± 0.097 | 7.569 ± 0.153 |
5.31 ± 0.149 | 6.431 ± 0.092 |
1.495 ± 0.048 | 3.195 ± 0.072 |
Most of the basic statistics you can see at this page can be downloaded from this CSV file
Proteome-pI is available under Creative Commons Attribution-NoDerivs license, for more details see here
| Reference: Kozlowski LP. Proteome-pI 2.0: Proteome Isoelectric Point Database Update. Nucleic Acids Res. 2021, doi: 10.1093/nar/gkab944 | Contact: Lukasz P. Kozlowski |
