Brugia pahangi (Filarial nematode worm)
Taxonomy: cellular organisms; Eukaryota; Opisthokonta; Metazoa; Eumetazoa; Bilateria; Protostomia; Ecdysozoa; Nematoda; Chromadorea; Rhabditida; Spirurina; Spiruromorpha; Filarioidea; Onchocercidae; Brugia
Average proteome isoelectric point is 6.9
Get precalculated fractions of proteins

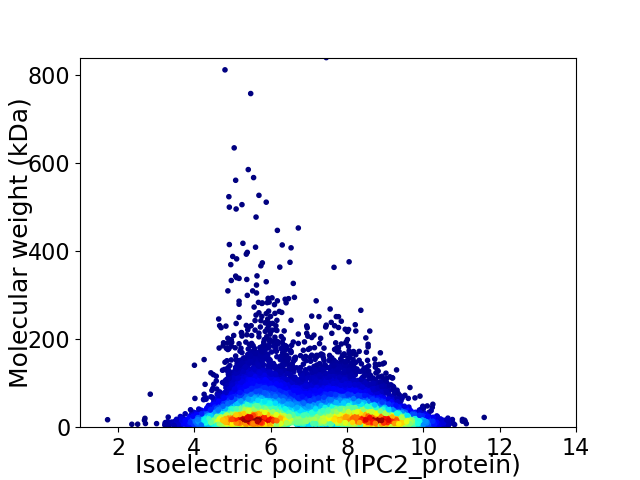
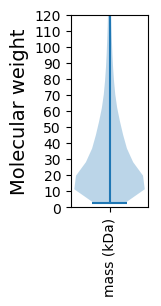
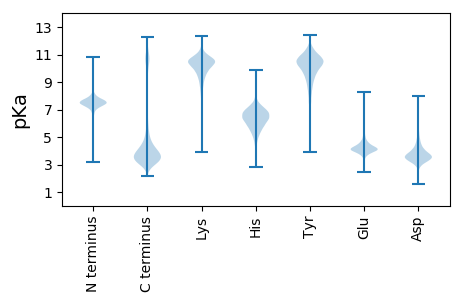
Virtual 2D-PAGE plot for 14545 proteins (isoelectric point calculated using IPC2_protein)
Get csv file with sequences according to given criteria:
* You can choose from 21 different methods for calculating isoelectric point
Summary statistics related to proteome-wise predictions


Protein with the lowest isoelectric point:
>tr|A0A0N4TC44|A0A0N4TC44_BRUPA Uncharacterized protein OS=Brugia pahangi OX=6280 GN=BPAG_LOCUS5744 PE=4 SV=1
MM1 pKa = 7.17RR2 pKa = 11.84QLYY5 pKa = 7.46VWCYY9 pKa = 10.42IDD11 pKa = 5.22IGLQGTEE18 pKa = 4.06EE19 pKa = 4.55SVSSAHH25 pKa = 6.16NGNGIEE31 pKa = 4.16EE32 pKa = 3.94QAEE35 pKa = 4.11YY36 pKa = 10.92DD37 pKa = 3.67EE38 pKa = 5.25KK39 pKa = 10.94RR40 pKa = 11.84AEE42 pKa = 4.17NGCGDD47 pKa = 5.58DD48 pKa = 5.29IDD50 pKa = 6.57DD51 pKa = 6.24DD52 pKa = 6.18GDD54 pKa = 5.06DD55 pKa = 4.58DD56 pKa = 5.85DD57 pKa = 5.13KK58 pKa = 12.05AHH60 pKa = 6.41LAIRR64 pKa = 11.84FSPQDD69 pKa = 3.14KK70 pKa = 10.19TILQNIYY77 pKa = 9.71QQMCEE82 pKa = 4.16CQEE85 pKa = 4.15LNPDD89 pKa = 3.79EE90 pKa = 6.04GDD92 pKa = 3.92DD93 pKa = 4.08FSDD96 pKa = 5.15DD97 pKa = 3.48FTMDD101 pKa = 3.53PDD103 pKa = 4.62GDD105 pKa = 3.73FSEE108 pKa = 4.53NKK110 pKa = 9.75SDD112 pKa = 4.25EE113 pKa = 4.31EE114 pKa = 3.81EE115 pKa = 4.67DD116 pKa = 3.93YY117 pKa = 11.38EE118 pKa = 5.13GNDD121 pKa = 4.53GEE123 pKa = 5.06GDD125 pKa = 3.6QNTLYY130 pKa = 10.83FQDD133 pKa = 3.07ISTNMRR139 pKa = 11.84RR140 pKa = 11.84HH141 pKa = 5.08EE142 pKa = 4.33TNGAYY147 pKa = 9.07MLRR150 pKa = 11.84IADD153 pKa = 4.03HH154 pKa = 6.82GDD156 pKa = 3.3AFGSEE161 pKa = 4.03QMDD164 pKa = 3.58EE165 pKa = 4.29GG166 pKa = 4.09
MM1 pKa = 7.17RR2 pKa = 11.84QLYY5 pKa = 7.46VWCYY9 pKa = 10.42IDD11 pKa = 5.22IGLQGTEE18 pKa = 4.06EE19 pKa = 4.55SVSSAHH25 pKa = 6.16NGNGIEE31 pKa = 4.16EE32 pKa = 3.94QAEE35 pKa = 4.11YY36 pKa = 10.92DD37 pKa = 3.67EE38 pKa = 5.25KK39 pKa = 10.94RR40 pKa = 11.84AEE42 pKa = 4.17NGCGDD47 pKa = 5.58DD48 pKa = 5.29IDD50 pKa = 6.57DD51 pKa = 6.24DD52 pKa = 6.18GDD54 pKa = 5.06DD55 pKa = 4.58DD56 pKa = 5.85DD57 pKa = 5.13KK58 pKa = 12.05AHH60 pKa = 6.41LAIRR64 pKa = 11.84FSPQDD69 pKa = 3.14KK70 pKa = 10.19TILQNIYY77 pKa = 9.71QQMCEE82 pKa = 4.16CQEE85 pKa = 4.15LNPDD89 pKa = 3.79EE90 pKa = 6.04GDD92 pKa = 3.92DD93 pKa = 4.08FSDD96 pKa = 5.15DD97 pKa = 3.48FTMDD101 pKa = 3.53PDD103 pKa = 4.62GDD105 pKa = 3.73FSEE108 pKa = 4.53NKK110 pKa = 9.75SDD112 pKa = 4.25EE113 pKa = 4.31EE114 pKa = 3.81EE115 pKa = 4.67DD116 pKa = 3.93YY117 pKa = 11.38EE118 pKa = 5.13GNDD121 pKa = 4.53GEE123 pKa = 5.06GDD125 pKa = 3.6QNTLYY130 pKa = 10.83FQDD133 pKa = 3.07ISTNMRR139 pKa = 11.84RR140 pKa = 11.84HH141 pKa = 5.08EE142 pKa = 4.33TNGAYY147 pKa = 9.07MLRR150 pKa = 11.84IADD153 pKa = 4.03HH154 pKa = 6.82GDD156 pKa = 3.3AFGSEE161 pKa = 4.03QMDD164 pKa = 3.58EE165 pKa = 4.29GG166 pKa = 4.09
Molecular weight: 18.83 kDa
Isoelectric point according different methods:
Protein with the highest isoelectric point:
>tr|A0A0N4TEV8|A0A0N4TEV8_BRUPA Uncharacterized protein OS=Brugia pahangi OX=6280 GN=BPAG_LOCUS4723 PE=4 SV=1
MM1 pKa = 6.37QAKK4 pKa = 8.35RR5 pKa = 11.84TGQGMQAKK13 pKa = 8.37RR14 pKa = 11.84TGQGMQAKK22 pKa = 8.37RR23 pKa = 11.84TGQGMQAKK31 pKa = 8.37RR32 pKa = 11.84TGQGMQAKK40 pKa = 8.37RR41 pKa = 11.84TGQGMQAKK49 pKa = 8.37RR50 pKa = 11.84TGQGMQAKK58 pKa = 8.37RR59 pKa = 11.84TGQGMQAKK67 pKa = 8.37RR68 pKa = 11.84TGQGMQQ74 pKa = 3.04
MM1 pKa = 6.37QAKK4 pKa = 8.35RR5 pKa = 11.84TGQGMQAKK13 pKa = 8.37RR14 pKa = 11.84TGQGMQAKK22 pKa = 8.37RR23 pKa = 11.84TGQGMQAKK31 pKa = 8.37RR32 pKa = 11.84TGQGMQAKK40 pKa = 8.37RR41 pKa = 11.84TGQGMQAKK49 pKa = 8.37RR50 pKa = 11.84TGQGMQAKK58 pKa = 8.37RR59 pKa = 11.84TGQGMQAKK67 pKa = 8.37RR68 pKa = 11.84TGQGMQQ74 pKa = 3.04
Molecular weight: 7.94 kDa
Isoelectric point according different methods:
Peptides (in silico digests for buttom-up proteomics)
Below you can find in silico digests of the whole proteome with Trypsin, Chymotrypsin, Trypsin+LysC, LysN, ArgC proteases suitable for different mass spec machines.| Try ESI |
 |
|---|
| ChTry ESI |
 |
|---|
| ArgC ESI |
 |
|---|
| LysN ESI |
 |
|---|
| TryLysC ESI |
 |
|---|
| Try MALDI |
 |
|---|
| ChTry MALDI |
 |
|---|
| ArgC MALDI |
 |
|---|
| LysN MALDI |
 |
|---|
| TryLysC MALDI |
 |
|---|
| Try LTQ |
 |
|---|
| ChTry LTQ |
 |
|---|
| ArgC LTQ |
 |
|---|
| LysN LTQ |
 |
|---|
| TryLysC LTQ |
 |
|---|
| Try MSlow |
 |
|---|
| ChTry MSlow |
 |
|---|
| ArgC MSlow |
 |
|---|
| LysN MSlow |
 |
|---|
| TryLysC MSlow |
 |
|---|
| Try MShigh |
 |
|---|
| ChTry MShigh |
 |
|---|
| ArgC MShigh |
 |
|---|
| LysN MShigh |
 |
|---|
| TryLysC MShigh |
 |
|---|
General Statistics
Number of major isoforms |
Number of additional isoforms |
Number of all proteins |
Number of amino acids |
Min. Seq. Length |
Max. Seq. Length |
Avg. Seq. Length |
Avg. Mol. Weight |
|---|---|---|---|---|---|---|---|
0 |
5004100 |
24 |
7308 |
344.0 |
39.04 |
Amino acid frequency
Ala |
Cys |
Asp |
Glu |
Phe |
Gly |
His |
Ile |
Lys |
Leu |
|---|---|---|---|---|---|---|---|---|---|
6.002 ± 0.018 | 2.269 ± 0.017 |
5.339 ± 0.02 | 6.447 ± 0.029 |
4.374 ± 0.017 | 4.976 ± 0.026 |
2.435 ± 0.011 | 6.754 ± 0.025 |
6.177 ± 0.024 | 9.367 ± 0.028 |
Met |
Asn |
Gln |
Pro |
Arg |
Ser |
Thr |
Val |
Trp |
Tyr |
|---|---|---|---|---|---|---|---|---|---|
2.551 ± 0.01 | 5.209 ± 0.019 |
4.166 ± 0.022 | 4.191 ± 0.02 |
5.639 ± 0.021 | 8.222 ± 0.027 |
5.616 ± 0.02 | 5.889 ± 0.017 |
1.102 ± 0.007 | 3.271 ± 0.014 |
Most of the basic statistics you can see at this page can be downloaded from this CSV file
Proteome-pI is available under Creative Commons Attribution-NoDerivs license, for more details see here
| Reference: Kozlowski LP. Proteome-pI 2.0: Proteome Isoelectric Point Database Update. Nucleic Acids Res. 2021, doi: 10.1093/nar/gkab944 | Contact: Lukasz P. Kozlowski |
