Eoetvoesia caeni
Taxonomy: cellular organisms; Bacteria; Proteobacteria; Betaproteobacteria; Burkholderiales; Alcaligenaceae; Eoetvoesia
Average proteome isoelectric point is 6.76
Get precalculated fractions of proteins

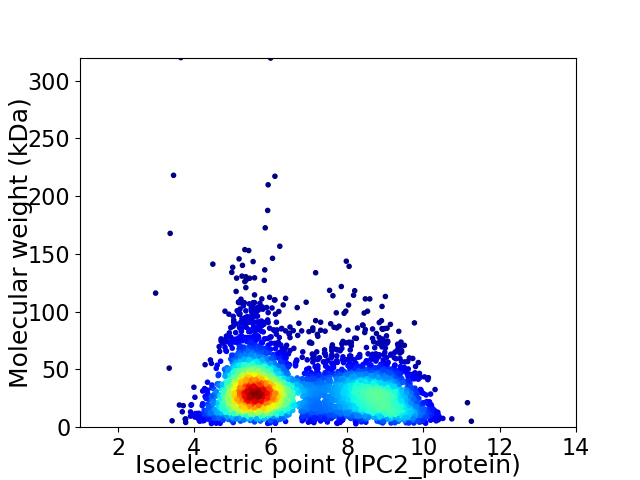
Virtual 2D-PAGE plot for 4508 proteins (isoelectric point calculated using IPC2_protein)
Get csv file with sequences according to given criteria:
* You can choose from 21 different methods for calculating isoelectric point
Summary statistics related to proteome-wise predictions


Protein with the lowest isoelectric point:
>tr|A0A366H7Z9|A0A366H7Z9_9BURK Thiosulfate dehydrogenase OS=Eoetvoesia caeni OX=645616 GN=DFR37_10787 PE=4 SV=1
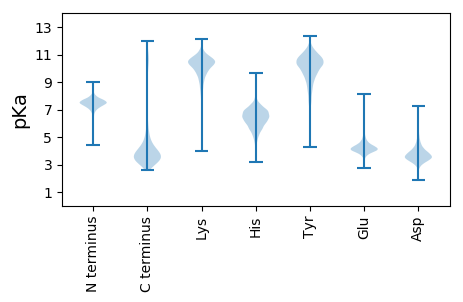
MM1 pKa = 7.67SDD3 pKa = 2.86IPEE6 pKa = 4.4NFDD9 pKa = 3.11TDD11 pKa = 3.28IATLVAALSCGDD23 pKa = 3.86LDD25 pKa = 3.48EE26 pKa = 6.7HH27 pKa = 6.64EE28 pKa = 4.37IARR31 pKa = 11.84IVGICRR37 pKa = 11.84QALEE41 pKa = 4.22NPAAVLAEE49 pKa = 4.13NYY51 pKa = 8.05GTEE54 pKa = 4.11AAEE57 pKa = 4.18VAQYY61 pKa = 11.1DD62 pKa = 4.01PQGVIAFIVFIEE74 pKa = 4.29LEE76 pKa = 4.35DD77 pKa = 3.84YY78 pKa = 10.69FAVADD83 pKa = 4.2TVDD86 pKa = 3.83EE87 pKa = 4.12LHH89 pKa = 6.37EE90 pKa = 4.08QIIAAFEE97 pKa = 4.1APQLPDD103 pKa = 3.43YY104 pKa = 10.69PYY106 pKa = 11.05DD107 pKa = 4.37DD108 pKa = 4.65NDD110 pKa = 3.64FEE112 pKa = 4.68TVSDD116 pKa = 3.87YY117 pKa = 10.56FQWLDD122 pKa = 3.37AQLLEE127 pKa = 3.93HH128 pKa = 6.61HH129 pKa = 6.4AAYY132 pKa = 10.54RR133 pKa = 11.84LIHH136 pKa = 6.43FGQSYY141 pKa = 9.67TNDD144 pKa = 3.17FQTVLVHH151 pKa = 7.61RR152 pKa = 11.84EE153 pKa = 4.13GTDD156 pKa = 3.14SLLALCRR163 pKa = 11.84KK164 pKa = 9.66LKK166 pKa = 11.03LEE168 pKa = 4.62AEE170 pKa = 4.41YY171 pKa = 11.37CEE173 pKa = 4.23
MM1 pKa = 7.67SDD3 pKa = 2.86IPEE6 pKa = 4.4NFDD9 pKa = 3.11TDD11 pKa = 3.28IATLVAALSCGDD23 pKa = 3.86LDD25 pKa = 3.48EE26 pKa = 6.7HH27 pKa = 6.64EE28 pKa = 4.37IARR31 pKa = 11.84IVGICRR37 pKa = 11.84QALEE41 pKa = 4.22NPAAVLAEE49 pKa = 4.13NYY51 pKa = 8.05GTEE54 pKa = 4.11AAEE57 pKa = 4.18VAQYY61 pKa = 11.1DD62 pKa = 4.01PQGVIAFIVFIEE74 pKa = 4.29LEE76 pKa = 4.35DD77 pKa = 3.84YY78 pKa = 10.69FAVADD83 pKa = 4.2TVDD86 pKa = 3.83EE87 pKa = 4.12LHH89 pKa = 6.37EE90 pKa = 4.08QIIAAFEE97 pKa = 4.1APQLPDD103 pKa = 3.43YY104 pKa = 10.69PYY106 pKa = 11.05DD107 pKa = 4.37DD108 pKa = 4.65NDD110 pKa = 3.64FEE112 pKa = 4.68TVSDD116 pKa = 3.87YY117 pKa = 10.56FQWLDD122 pKa = 3.37AQLLEE127 pKa = 3.93HH128 pKa = 6.61HH129 pKa = 6.4AAYY132 pKa = 10.54RR133 pKa = 11.84LIHH136 pKa = 6.43FGQSYY141 pKa = 9.67TNDD144 pKa = 3.17FQTVLVHH151 pKa = 7.61RR152 pKa = 11.84EE153 pKa = 4.13GTDD156 pKa = 3.14SLLALCRR163 pKa = 11.84KK164 pKa = 9.66LKK166 pKa = 11.03LEE168 pKa = 4.62AEE170 pKa = 4.41YY171 pKa = 11.37CEE173 pKa = 4.23
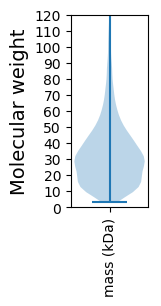
Molecular weight: 19.51 kDa
Isoelectric point according different methods:
Protein with the highest isoelectric point:
>tr|A0A366HHH1|A0A366HHH1_9BURK Xanthine dehydrogenase YagT iron-sulfur-binding subunit OS=Eoetvoesia caeni OX=645616 GN=DFR37_102393 PE=4 SV=1
MM1 pKa = 7.45KK2 pKa = 9.51RR3 pKa = 11.84TFQPSVTRR11 pKa = 11.84RR12 pKa = 11.84KK13 pKa = 8.43RR14 pKa = 11.84THH16 pKa = 5.88GFLVRR21 pKa = 11.84MKK23 pKa = 9.7TRR25 pKa = 11.84GGRR28 pKa = 11.84AVIKK32 pKa = 10.36ARR34 pKa = 11.84RR35 pKa = 11.84AKK37 pKa = 9.79GRR39 pKa = 11.84KK40 pKa = 8.75RR41 pKa = 11.84LAVV44 pKa = 3.41
MM1 pKa = 7.45KK2 pKa = 9.51RR3 pKa = 11.84TFQPSVTRR11 pKa = 11.84RR12 pKa = 11.84KK13 pKa = 8.43RR14 pKa = 11.84THH16 pKa = 5.88GFLVRR21 pKa = 11.84MKK23 pKa = 9.7TRR25 pKa = 11.84GGRR28 pKa = 11.84AVIKK32 pKa = 10.36ARR34 pKa = 11.84RR35 pKa = 11.84AKK37 pKa = 9.79GRR39 pKa = 11.84KK40 pKa = 8.75RR41 pKa = 11.84LAVV44 pKa = 3.41
Molecular weight: 5.16 kDa
Isoelectric point according different methods:
Peptides (in silico digests for buttom-up proteomics)
Below you can find in silico digests of the whole proteome with Trypsin, Chymotrypsin, Trypsin+LysC, LysN, ArgC proteases suitable for different mass spec machines.| Try ESI |
 |
|---|
| ChTry ESI |
 |
|---|
| ArgC ESI |
 |
|---|
| LysN ESI |
 |
|---|
| TryLysC ESI |
 |
|---|
| Try MALDI |
 |
|---|
| ChTry MALDI |
 |
|---|
| ArgC MALDI |
 |
|---|
| LysN MALDI |
 |
|---|
| TryLysC MALDI |
 |
|---|
| Try LTQ |
 |
|---|
| ChTry LTQ |
 |
|---|
| ArgC LTQ |
 |
|---|
| LysN LTQ |
 |
|---|
| TryLysC LTQ |
 |
|---|
| Try MSlow |
 |
|---|
| ChTry MSlow |
 |
|---|
| ArgC MSlow |
 |
|---|
| LysN MSlow |
 |
|---|
| TryLysC MSlow |
 |
|---|
| Try MShigh |
 |
|---|
| ChTry MShigh |
 |
|---|
| ArgC MShigh |
 |
|---|
| LysN MShigh |
 |
|---|
| TryLysC MShigh |
 |
|---|
General Statistics
Number of major isoforms |
Number of additional isoforms |
Number of all proteins |
Number of amino acids |
Min. Seq. Length |
Max. Seq. Length |
Avg. Seq. Length |
Avg. Mol. Weight |
|---|---|---|---|---|---|---|---|
0 |
1422334 |
27 |
3222 |
315.5 |
34.46 |
Amino acid frequency
Ala |
Cys |
Asp |
Glu |
Phe |
Gly |
His |
Ile |
Lys |
Leu |
|---|---|---|---|---|---|---|---|---|---|
11.625 ± 0.043 | 0.943 ± 0.012 |
5.29 ± 0.033 | 5.335 ± 0.035 |
3.568 ± 0.023 | 8.012 ± 0.038 |
2.29 ± 0.017 | 5.116 ± 0.025 |
3.584 ± 0.029 | 10.607 ± 0.049 |
Met |
Asn |
Gln |
Pro |
Arg |
Ser |
Thr |
Val |
Trp |
Tyr |
|---|---|---|---|---|---|---|---|---|---|
2.533 ± 0.019 | 3.0 ± 0.02 |
5.048 ± 0.022 | 4.227 ± 0.023 |
6.455 ± 0.04 | 5.842 ± 0.029 |
5.209 ± 0.038 | 7.328 ± 0.033 |
1.441 ± 0.014 | 2.546 ± 0.019 |
Most of the basic statistics you can see at this page can be downloaded from this CSV file
Proteome-pI is available under Creative Commons Attribution-NoDerivs license, for more details see here
| Reference: Kozlowski LP. Proteome-pI 2.0: Proteome Isoelectric Point Database Update. Nucleic Acids Res. 2021, doi: 10.1093/nar/gkab944 | Contact: Lukasz P. Kozlowski |
