Marihabitans asiaticum
Taxonomy: cellular organisms; Bacteria; Terrabacteria group; Actinobacteria; Actinomycetia; Micrococcales; Intrasporangiaceae; Marihabitans
Average proteome isoelectric point is 5.88
Get precalculated fractions of proteins

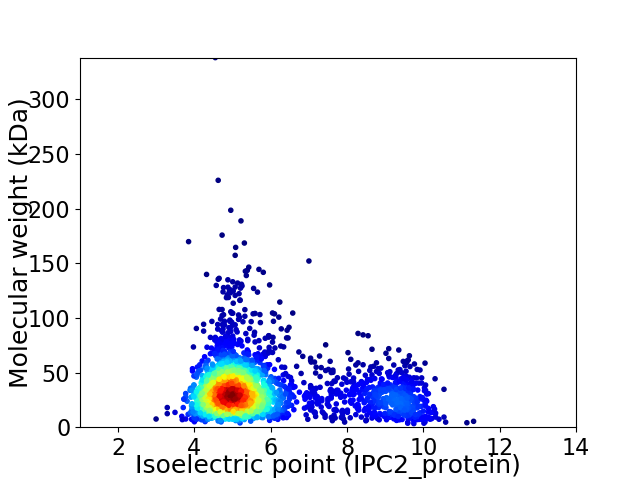
Virtual 2D-PAGE plot for 2675 proteins (isoelectric point calculated using IPC2_protein)
Get csv file with sequences according to given criteria:
* You can choose from 21 different methods for calculating isoelectric point
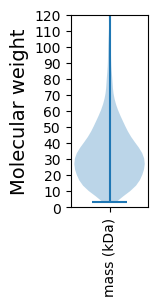
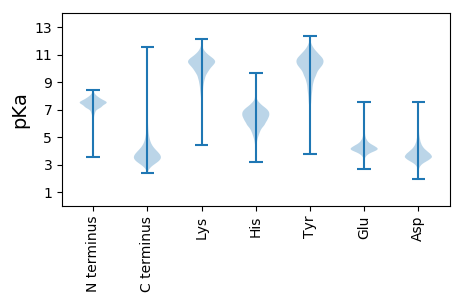
Summary statistics related to proteome-wise predictions


Protein with the lowest isoelectric point:
>tr|A0A560WEG0|A0A560WEG0_9MICO Transport permease protein OS=Marihabitans asiaticum OX=415218 GN=FB557_1604 PE=3 SV=1
MM1 pKa = 7.1SHH3 pKa = 7.01AGGPYY8 pKa = 10.29GSDD11 pKa = 3.53APPPPPPGQGAGGGYY26 pKa = 10.13GGYY29 pKa = 9.13PGPAGGPGEE38 pKa = 4.73AGYY41 pKa = 10.51GPPGDD46 pKa = 4.32GGYY49 pKa = 10.52GPPGGGYY56 pKa = 8.66PPHH59 pKa = 6.97VDD61 pKa = 3.79GYY63 pKa = 11.46GEE65 pKa = 4.04QPPKK69 pKa = 10.51KK70 pKa = 10.11RR71 pKa = 11.84NTLLIGALIGGALLLLLCCGGVVALGMMGSSGFDD105 pKa = 3.23EE106 pKa = 5.53APGEE110 pKa = 4.45TTSATSEE117 pKa = 4.06PSEE120 pKa = 4.48SPTSSEE126 pKa = 4.1TPTQSEE132 pKa = 5.06TPTSSASPSEE142 pKa = 4.47SEE144 pKa = 4.26GSASEE149 pKa = 4.65GEE151 pKa = 4.33DD152 pKa = 3.75LGFPDD157 pKa = 6.09EE158 pKa = 4.16FDD160 pKa = 2.6GWQRR164 pKa = 11.84SDD166 pKa = 3.48QQASAPQGSQGAIYY180 pKa = 9.67TKK182 pKa = 10.16DD183 pKa = 3.19DD184 pKa = 3.39KK185 pKa = 11.6AIVVVATDD193 pKa = 4.03DD194 pKa = 4.1APGAMDD200 pKa = 4.34GFKK203 pKa = 10.14MVWSDD208 pKa = 4.79DD209 pKa = 3.52KK210 pKa = 11.75DD211 pKa = 3.68VDD213 pKa = 3.92GGVCGKK219 pKa = 9.89IVSQTQCAATDD230 pKa = 3.86DD231 pKa = 3.94GTIFILNDD239 pKa = 3.15TDD241 pKa = 4.73GGDD244 pKa = 3.76FEE246 pKa = 5.43QVMGTLQAFLDD257 pKa = 3.94ARR259 pKa = 4.09
MM1 pKa = 7.1SHH3 pKa = 7.01AGGPYY8 pKa = 10.29GSDD11 pKa = 3.53APPPPPPGQGAGGGYY26 pKa = 10.13GGYY29 pKa = 9.13PGPAGGPGEE38 pKa = 4.73AGYY41 pKa = 10.51GPPGDD46 pKa = 4.32GGYY49 pKa = 10.52GPPGGGYY56 pKa = 8.66PPHH59 pKa = 6.97VDD61 pKa = 3.79GYY63 pKa = 11.46GEE65 pKa = 4.04QPPKK69 pKa = 10.51KK70 pKa = 10.11RR71 pKa = 11.84NTLLIGALIGGALLLLLCCGGVVALGMMGSSGFDD105 pKa = 3.23EE106 pKa = 5.53APGEE110 pKa = 4.45TTSATSEE117 pKa = 4.06PSEE120 pKa = 4.48SPTSSEE126 pKa = 4.1TPTQSEE132 pKa = 5.06TPTSSASPSEE142 pKa = 4.47SEE144 pKa = 4.26GSASEE149 pKa = 4.65GEE151 pKa = 4.33DD152 pKa = 3.75LGFPDD157 pKa = 6.09EE158 pKa = 4.16FDD160 pKa = 2.6GWQRR164 pKa = 11.84SDD166 pKa = 3.48QQASAPQGSQGAIYY180 pKa = 9.67TKK182 pKa = 10.16DD183 pKa = 3.19DD184 pKa = 3.39KK185 pKa = 11.6AIVVVATDD193 pKa = 4.03DD194 pKa = 4.1APGAMDD200 pKa = 4.34GFKK203 pKa = 10.14MVWSDD208 pKa = 4.79DD209 pKa = 3.52KK210 pKa = 11.75DD211 pKa = 3.68VDD213 pKa = 3.92GGVCGKK219 pKa = 9.89IVSQTQCAATDD230 pKa = 3.86DD231 pKa = 3.94GTIFILNDD239 pKa = 3.15TDD241 pKa = 4.73GGDD244 pKa = 3.76FEE246 pKa = 5.43QVMGTLQAFLDD257 pKa = 3.94ARR259 pKa = 4.09
Molecular weight: 25.81 kDa
Isoelectric point according different methods:
Protein with the highest isoelectric point:
>tr|A0A560WGI1|A0A560WGI1_9MICO CP family cyanate transporter-like MFS transporter OS=Marihabitans asiaticum OX=415218 GN=FB557_0329 PE=4 SV=1
MM1 pKa = 7.69SKK3 pKa = 9.0RR4 pKa = 11.84TFQPNNRR11 pKa = 11.84RR12 pKa = 11.84RR13 pKa = 11.84AKK15 pKa = 8.7THH17 pKa = 5.15GFRR20 pKa = 11.84LRR22 pKa = 11.84MRR24 pKa = 11.84TRR26 pKa = 11.84AGRR29 pKa = 11.84SILANRR35 pKa = 11.84RR36 pKa = 11.84AKK38 pKa = 10.29GRR40 pKa = 11.84RR41 pKa = 11.84KK42 pKa = 10.19LSAA45 pKa = 3.66
MM1 pKa = 7.69SKK3 pKa = 9.0RR4 pKa = 11.84TFQPNNRR11 pKa = 11.84RR12 pKa = 11.84RR13 pKa = 11.84AKK15 pKa = 8.7THH17 pKa = 5.15GFRR20 pKa = 11.84LRR22 pKa = 11.84MRR24 pKa = 11.84TRR26 pKa = 11.84AGRR29 pKa = 11.84SILANRR35 pKa = 11.84RR36 pKa = 11.84AKK38 pKa = 10.29GRR40 pKa = 11.84RR41 pKa = 11.84KK42 pKa = 10.19LSAA45 pKa = 3.66
Molecular weight: 5.37 kDa
Isoelectric point according different methods:
Peptides (in silico digests for buttom-up proteomics)
Below you can find in silico digests of the whole proteome with Trypsin, Chymotrypsin, Trypsin+LysC, LysN, ArgC proteases suitable for different mass spec machines.| Try ESI |
 |
|---|
| ChTry ESI |
 |
|---|
| ArgC ESI |
 |
|---|
| LysN ESI |
 |
|---|
| TryLysC ESI |
 |
|---|
| Try MALDI |
 |
|---|
| ChTry MALDI |
 |
|---|
| ArgC MALDI |
 |
|---|
| LysN MALDI |
 |
|---|
| TryLysC MALDI |
 |
|---|
| Try LTQ |
 |
|---|
| ChTry LTQ |
 |
|---|
| ArgC LTQ |
 |
|---|
| LysN LTQ |
 |
|---|
| TryLysC LTQ |
 |
|---|
| Try MSlow |
 |
|---|
| ChTry MSlow |
 |
|---|
| ArgC MSlow |
 |
|---|
| LysN MSlow |
 |
|---|
| TryLysC MSlow |
 |
|---|
| Try MShigh |
 |
|---|
| ChTry MShigh |
 |
|---|
| ArgC MShigh |
 |
|---|
| LysN MShigh |
 |
|---|
| TryLysC MShigh |
 |
|---|
General Statistics
Number of major isoforms |
Number of additional isoforms |
Number of all proteins |
Number of amino acids |
Min. Seq. Length |
Max. Seq. Length |
Avg. Seq. Length |
Avg. Mol. Weight |
|---|---|---|---|---|---|---|---|
0 |
889342 |
29 |
3310 |
332.5 |
35.6 |
Amino acid frequency
Ala |
Cys |
Asp |
Glu |
Phe |
Gly |
His |
Ile |
Lys |
Leu |
|---|---|---|---|---|---|---|---|---|---|
12.852 ± 0.065 | 0.7 ± 0.013 |
6.51 ± 0.042 | 6.351 ± 0.041 |
2.527 ± 0.029 | 9.396 ± 0.04 |
2.227 ± 0.024 | 3.6 ± 0.03 |
1.946 ± 0.037 | 10.117 ± 0.06 |
Met |
Asn |
Gln |
Pro |
Arg |
Ser |
Thr |
Val |
Trp |
Tyr |
|---|---|---|---|---|---|---|---|---|---|
1.918 ± 0.018 | 1.512 ± 0.02 |
5.553 ± 0.038 | 2.969 ± 0.023 |
7.755 ± 0.054 | 5.513 ± 0.034 |
5.959 ± 0.036 | 9.275 ± 0.046 |
1.49 ± 0.022 | 1.831 ± 0.02 |
Most of the basic statistics you can see at this page can be downloaded from this CSV file
Proteome-pI is available under Creative Commons Attribution-NoDerivs license, for more details see here
| Reference: Kozlowski LP. Proteome-pI 2.0: Proteome Isoelectric Point Database Update. Nucleic Acids Res. 2021, doi: 10.1093/nar/gkab944 | Contact: Lukasz P. Kozlowski |
