Hymenobacter sp. BRD67
Taxonomy: cellular organisms; Bacteria; FCB group; Bacteroidetes/Chlorobi group; Bacteroidetes; Cytophagia; Cytophagales; Hymenobacteraceae; Hymenobacter; unclassified Hymenobacter
Average proteome isoelectric point is 7.15
Get precalculated fractions of proteins

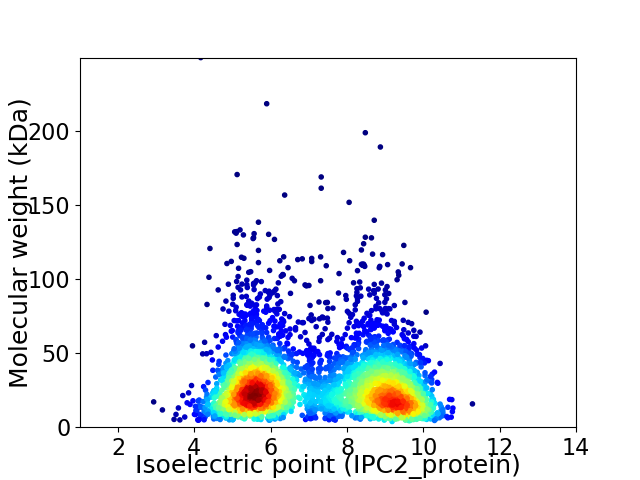
Virtual 2D-PAGE plot for 3905 proteins (isoelectric point calculated using IPC2_protein)
Get csv file with sequences according to given criteria:
* You can choose from 21 different methods for calculating isoelectric point
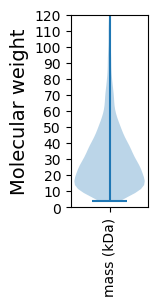
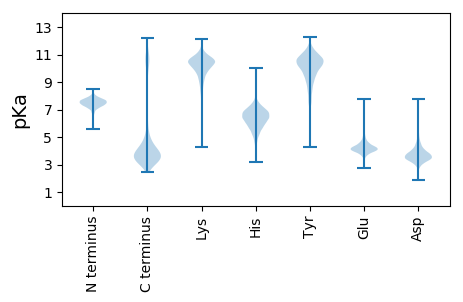
Summary statistics related to proteome-wise predictions


Protein with the lowest isoelectric point:
>tr|A0A7D4BBL4|A0A7D4BBL4_9BACT Pyridoxal phosphate-dependent aminotransferase OS=Hymenobacter sp. BRD67 OX=2675877 GN=GKZ67_04695 PE=4 SV=1
MM1 pKa = 7.8LSTTDD6 pKa = 3.56YY7 pKa = 9.79TALPPAADD15 pKa = 3.91LQRR18 pKa = 11.84LCQALAALDD27 pKa = 3.99AVNSPDD33 pKa = 3.04EE34 pKa = 4.16EE35 pKa = 4.11YY36 pKa = 10.61RR37 pKa = 11.84YY38 pKa = 10.19FSYY41 pKa = 10.95NPEE44 pKa = 3.66WSEE47 pKa = 3.88NEE49 pKa = 3.87AAFEE53 pKa = 4.46LNDD56 pKa = 4.22GEE58 pKa = 4.75GDD60 pKa = 3.45QLLVLFRR67 pKa = 11.84PEE69 pKa = 3.93GCVMNGFLAGYY80 pKa = 7.41DD81 pKa = 3.74QPDD84 pKa = 3.62KK85 pKa = 11.44ALATHH90 pKa = 6.84GLPAAFEE97 pKa = 4.05EE98 pKa = 5.0FMFGEE103 pKa = 4.8PVASIGTTFCLWYY116 pKa = 9.47TPVQGWQGGAADD128 pKa = 4.33GSEE131 pKa = 4.3EE132 pKa = 4.72LLFMLDD138 pKa = 3.88NQPATYY144 pKa = 10.08AAWATEE150 pKa = 4.4YY151 pKa = 9.89YY152 pKa = 10.19TEE154 pKa = 4.19EE155 pKa = 4.12TDD157 pKa = 3.71KK158 pKa = 11.55KK159 pKa = 9.5PVSASAVAPVYY170 pKa = 9.98RR171 pKa = 11.84HH172 pKa = 5.72EE173 pKa = 4.24VLTRR177 pKa = 11.84ARR179 pKa = 11.84VLALVDD185 pKa = 4.41EE186 pKa = 5.09LEE188 pKa = 4.91DD189 pKa = 3.84WPQLAADD196 pKa = 4.88LQQIGYY202 pKa = 8.3PYY204 pKa = 10.71DD205 pKa = 3.55FEE207 pKa = 4.99GVV209 pKa = 3.28
MM1 pKa = 7.8LSTTDD6 pKa = 3.56YY7 pKa = 9.79TALPPAADD15 pKa = 3.91LQRR18 pKa = 11.84LCQALAALDD27 pKa = 3.99AVNSPDD33 pKa = 3.04EE34 pKa = 4.16EE35 pKa = 4.11YY36 pKa = 10.61RR37 pKa = 11.84YY38 pKa = 10.19FSYY41 pKa = 10.95NPEE44 pKa = 3.66WSEE47 pKa = 3.88NEE49 pKa = 3.87AAFEE53 pKa = 4.46LNDD56 pKa = 4.22GEE58 pKa = 4.75GDD60 pKa = 3.45QLLVLFRR67 pKa = 11.84PEE69 pKa = 3.93GCVMNGFLAGYY80 pKa = 7.41DD81 pKa = 3.74QPDD84 pKa = 3.62KK85 pKa = 11.44ALATHH90 pKa = 6.84GLPAAFEE97 pKa = 4.05EE98 pKa = 5.0FMFGEE103 pKa = 4.8PVASIGTTFCLWYY116 pKa = 9.47TPVQGWQGGAADD128 pKa = 4.33GSEE131 pKa = 4.3EE132 pKa = 4.72LLFMLDD138 pKa = 3.88NQPATYY144 pKa = 10.08AAWATEE150 pKa = 4.4YY151 pKa = 9.89YY152 pKa = 10.19TEE154 pKa = 4.19EE155 pKa = 4.12TDD157 pKa = 3.71KK158 pKa = 11.55KK159 pKa = 9.5PVSASAVAPVYY170 pKa = 9.98RR171 pKa = 11.84HH172 pKa = 5.72EE173 pKa = 4.24VLTRR177 pKa = 11.84ARR179 pKa = 11.84VLALVDD185 pKa = 4.41EE186 pKa = 5.09LEE188 pKa = 4.91DD189 pKa = 3.84WPQLAADD196 pKa = 4.88LQQIGYY202 pKa = 8.3PYY204 pKa = 10.71DD205 pKa = 3.55FEE207 pKa = 4.99GVV209 pKa = 3.28
Molecular weight: 23.16 kDa
Isoelectric point according different methods:
Protein with the highest isoelectric point:
>tr|A0A7D3WQX6|A0A7D3WQX6_9BACT DUF4252 domain-containing protein OS=Hymenobacter sp. BRD67 OX=2675877 GN=GKZ67_00420 PE=4 SV=1
MM1 pKa = 7.52KK2 pKa = 10.28LATVFLLSTIKK13 pKa = 10.69FLGGPLAGSKK23 pKa = 9.27MGLGFWPTLGLTVAGMMTSVFIISGVGRR51 pKa = 11.84TWVLHH56 pKa = 5.25RR57 pKa = 11.84QQQRR61 pKa = 11.84RR62 pKa = 11.84LRR64 pKa = 11.84RR65 pKa = 11.84VPVFSKK71 pKa = 10.48RR72 pKa = 11.84SRR74 pKa = 11.84NIIKK78 pKa = 9.39VFKK81 pKa = 9.58RR82 pKa = 11.84FGMGGIAFLTPVLLSPIGGTVIATLLGVPRR112 pKa = 11.84QRR114 pKa = 11.84ILLHH118 pKa = 5.58MLWSAVLWGGVLTLASTRR136 pKa = 11.84IGHH139 pKa = 5.87MLHH142 pKa = 6.73HH143 pKa = 7.27
MM1 pKa = 7.52KK2 pKa = 10.28LATVFLLSTIKK13 pKa = 10.69FLGGPLAGSKK23 pKa = 9.27MGLGFWPTLGLTVAGMMTSVFIISGVGRR51 pKa = 11.84TWVLHH56 pKa = 5.25RR57 pKa = 11.84QQQRR61 pKa = 11.84RR62 pKa = 11.84LRR64 pKa = 11.84RR65 pKa = 11.84VPVFSKK71 pKa = 10.48RR72 pKa = 11.84SRR74 pKa = 11.84NIIKK78 pKa = 9.39VFKK81 pKa = 9.58RR82 pKa = 11.84FGMGGIAFLTPVLLSPIGGTVIATLLGVPRR112 pKa = 11.84QRR114 pKa = 11.84ILLHH118 pKa = 5.58MLWSAVLWGGVLTLASTRR136 pKa = 11.84IGHH139 pKa = 5.87MLHH142 pKa = 6.73HH143 pKa = 7.27
Molecular weight: 15.73 kDa
Isoelectric point according different methods:
Peptides (in silico digests for buttom-up proteomics)
Below you can find in silico digests of the whole proteome with Trypsin, Chymotrypsin, Trypsin+LysC, LysN, ArgC proteases suitable for different mass spec machines.| Try ESI |
 |
|---|
| ChTry ESI |
 |
|---|
| ArgC ESI |
 |
|---|
| LysN ESI |
 |
|---|
| TryLysC ESI |
 |
|---|
| Try MALDI |
 |
|---|
| ChTry MALDI |
 |
|---|
| ArgC MALDI |
 |
|---|
| LysN MALDI |
 |
|---|
| TryLysC MALDI |
 |
|---|
| Try LTQ |
 |
|---|
| ChTry LTQ |
 |
|---|
| ArgC LTQ |
 |
|---|
| LysN LTQ |
 |
|---|
| TryLysC LTQ |
 |
|---|
| Try MSlow |
 |
|---|
| ChTry MSlow |
 |
|---|
| ArgC MSlow |
 |
|---|
| LysN MSlow |
 |
|---|
| TryLysC MSlow |
 |
|---|
| Try MShigh |
 |
|---|
| ChTry MShigh |
 |
|---|
| ArgC MShigh |
 |
|---|
| LysN MShigh |
 |
|---|
| TryLysC MShigh |
 |
|---|
General Statistics
Number of major isoforms |
Number of additional isoforms |
Number of all proteins |
Number of amino acids |
Min. Seq. Length |
Max. Seq. Length |
Avg. Seq. Length |
Avg. Mol. Weight |
|---|---|---|---|---|---|---|---|
0 |
1139927 |
34 |
2524 |
291.9 |
31.94 |
Amino acid frequency
Ala |
Cys |
Asp |
Glu |
Phe |
Gly |
His |
Ile |
Lys |
Leu |
|---|---|---|---|---|---|---|---|---|---|
11.323 ± 0.053 | 0.778 ± 0.012 |
4.658 ± 0.031 | 4.79 ± 0.049 |
3.882 ± 0.024 | 7.852 ± 0.049 |
2.11 ± 0.02 | 4.142 ± 0.038 |
3.684 ± 0.048 | 11.181 ± 0.056 |
Met |
Asn |
Gln |
Pro |
Arg |
Ser |
Thr |
Val |
Trp |
Tyr |
|---|---|---|---|---|---|---|---|---|---|
1.739 ± 0.021 | 3.614 ± 0.037 |
5.524 ± 0.034 | 4.722 ± 0.033 |
6.105 ± 0.044 | 5.738 ± 0.043 |
6.5 ± 0.063 | 6.926 ± 0.035 |
1.255 ± 0.017 | 3.477 ± 0.024 |
Most of the basic statistics you can see at this page can be downloaded from this CSV file
Proteome-pI is available under Creative Commons Attribution-NoDerivs license, for more details see here
| Reference: Kozlowski LP. Proteome-pI 2.0: Proteome Isoelectric Point Database Update. Nucleic Acids Res. 2021, doi: 10.1093/nar/gkab944 | Contact: Lukasz P. Kozlowski |
