Pseudoxanthomonas suwonensis (strain 11-1)
Taxonomy: cellular organisms; Bacteria; Proteobacteria; Gammaproteobacteria; Xanthomonadales; Xanthomonadaceae; Pseudoxanthomonas; Pseudoxanthomonas suwonensis
Average proteome isoelectric point is 6.55
Get precalculated fractions of proteins

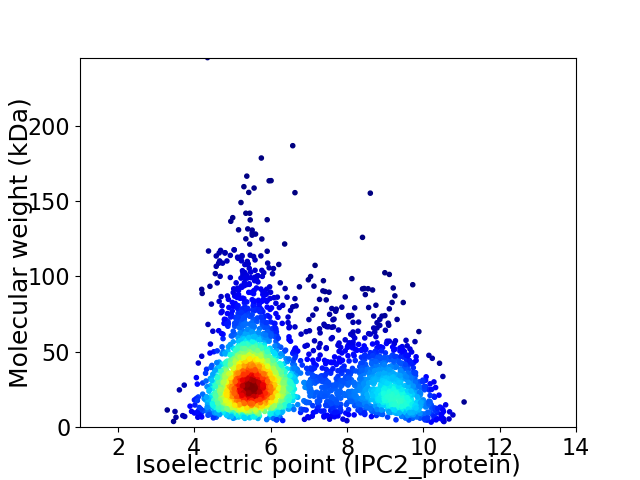
Virtual 2D-PAGE plot for 3068 proteins (isoelectric point calculated using IPC2_protein)
Get csv file with sequences according to given criteria:
* You can choose from 21 different methods for calculating isoelectric point
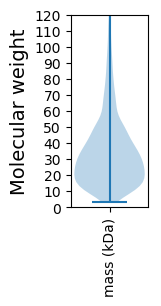
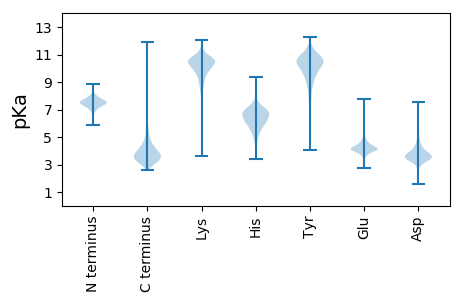
Summary statistics related to proteome-wise predictions


Protein with the lowest isoelectric point:
>tr|E6WVA4|E6WVA4_PSEUU Sulfate ABC transporter periplasmic sulfate-binding protein OS=Pseudoxanthomonas suwonensis (strain 11-1) OX=743721 GN=Psesu_2269 PE=4 SV=1
MM1 pKa = 7.76KK2 pKa = 10.23SFKK5 pKa = 10.38LAASLAVLLSAAPFAAFAQEE25 pKa = 4.2EE26 pKa = 4.36EE27 pKa = 5.27SPFSWEE33 pKa = 3.6VTAVSDD39 pKa = 4.09YY40 pKa = 9.8VWRR43 pKa = 11.84GVSQSDD49 pKa = 4.29EE50 pKa = 4.43EE51 pKa = 4.43PTLQAGFTYY60 pKa = 9.83TSPSGFYY67 pKa = 10.41AGVWGSGVDD76 pKa = 4.54FGPGDD81 pKa = 3.73PNAEE85 pKa = 3.54VDD87 pKa = 4.39GFIGYY92 pKa = 7.65NTDD95 pKa = 4.1FSDD98 pKa = 3.87SVNFDD103 pKa = 3.27VMINRR108 pKa = 11.84YY109 pKa = 6.56TYY111 pKa = 10.49PGASEE116 pKa = 5.27LNFNEE121 pKa = 5.61LITTTTFAEE130 pKa = 4.5NYY132 pKa = 8.78SLTVAYY138 pKa = 9.65TNDD141 pKa = 3.38FGGADD146 pKa = 3.19AKK148 pKa = 10.73AWYY151 pKa = 9.11VAGGASFGLPNEE163 pKa = 4.29FSLDD167 pKa = 3.65LGVGRR172 pKa = 11.84SLFDD176 pKa = 4.24DD177 pKa = 5.53DD178 pKa = 5.17YY179 pKa = 12.02SEE181 pKa = 6.46DD182 pKa = 3.68YY183 pKa = 10.65TDD185 pKa = 3.12WSVGLSRR192 pKa = 11.84SWGLFSASLAYY203 pKa = 10.56VGTDD207 pKa = 3.05GNGRR211 pKa = 11.84DD212 pKa = 4.07LFGDD216 pKa = 3.87LADD219 pKa = 4.38DD220 pKa = 3.75RR221 pKa = 11.84VVLSLSIGQQ230 pKa = 3.56
MM1 pKa = 7.76KK2 pKa = 10.23SFKK5 pKa = 10.38LAASLAVLLSAAPFAAFAQEE25 pKa = 4.2EE26 pKa = 4.36EE27 pKa = 5.27SPFSWEE33 pKa = 3.6VTAVSDD39 pKa = 4.09YY40 pKa = 9.8VWRR43 pKa = 11.84GVSQSDD49 pKa = 4.29EE50 pKa = 4.43EE51 pKa = 4.43PTLQAGFTYY60 pKa = 9.83TSPSGFYY67 pKa = 10.41AGVWGSGVDD76 pKa = 4.54FGPGDD81 pKa = 3.73PNAEE85 pKa = 3.54VDD87 pKa = 4.39GFIGYY92 pKa = 7.65NTDD95 pKa = 4.1FSDD98 pKa = 3.87SVNFDD103 pKa = 3.27VMINRR108 pKa = 11.84YY109 pKa = 6.56TYY111 pKa = 10.49PGASEE116 pKa = 5.27LNFNEE121 pKa = 5.61LITTTTFAEE130 pKa = 4.5NYY132 pKa = 8.78SLTVAYY138 pKa = 9.65TNDD141 pKa = 3.38FGGADD146 pKa = 3.19AKK148 pKa = 10.73AWYY151 pKa = 9.11VAGGASFGLPNEE163 pKa = 4.29FSLDD167 pKa = 3.65LGVGRR172 pKa = 11.84SLFDD176 pKa = 4.24DD177 pKa = 5.53DD178 pKa = 5.17YY179 pKa = 12.02SEE181 pKa = 6.46DD182 pKa = 3.68YY183 pKa = 10.65TDD185 pKa = 3.12WSVGLSRR192 pKa = 11.84SWGLFSASLAYY203 pKa = 10.56VGTDD207 pKa = 3.05GNGRR211 pKa = 11.84DD212 pKa = 4.07LFGDD216 pKa = 3.87LADD219 pKa = 4.38DD220 pKa = 3.75RR221 pKa = 11.84VVLSLSIGQQ230 pKa = 3.56
Molecular weight: 24.75 kDa
Isoelectric point according different methods:
Protein with the highest isoelectric point:
>tr|E6WPG4|E6WPG4_PSEUU Activator of Hsp90 ATPase 1 family protein OS=Pseudoxanthomonas suwonensis (strain 11-1) OX=743721 GN=Psesu_0347 PE=3 SV=1
MM1 pKa = 7.11QAQSGNPRR9 pKa = 11.84RR10 pKa = 11.84SGPWASAVALLGGLAGLVFGRR31 pKa = 11.84LVGSWLPEE39 pKa = 3.82SPPWVGPGIVVGSLALLLVGTFLLPLFRR67 pKa = 11.84RR68 pKa = 11.84HH69 pKa = 5.62RR70 pKa = 11.84APRR73 pKa = 11.84GRR75 pKa = 11.84ARR77 pKa = 3.67
MM1 pKa = 7.11QAQSGNPRR9 pKa = 11.84RR10 pKa = 11.84SGPWASAVALLGGLAGLVFGRR31 pKa = 11.84LVGSWLPEE39 pKa = 3.82SPPWVGPGIVVGSLALLLVGTFLLPLFRR67 pKa = 11.84RR68 pKa = 11.84HH69 pKa = 5.62RR70 pKa = 11.84APRR73 pKa = 11.84GRR75 pKa = 11.84ARR77 pKa = 3.67
Molecular weight: 8.12 kDa
Isoelectric point according different methods:
Peptides (in silico digests for buttom-up proteomics)
Below you can find in silico digests of the whole proteome with Trypsin, Chymotrypsin, Trypsin+LysC, LysN, ArgC proteases suitable for different mass spec machines.| Try ESI |
 |
|---|
| ChTry ESI |
 |
|---|
| ArgC ESI |
 |
|---|
| LysN ESI |
 |
|---|
| TryLysC ESI |
 |
|---|
| Try MALDI |
 |
|---|
| ChTry MALDI |
 |
|---|
| ArgC MALDI |
 |
|---|
| LysN MALDI |
 |
|---|
| TryLysC MALDI |
 |
|---|
| Try LTQ |
 |
|---|
| ChTry LTQ |
 |
|---|
| ArgC LTQ |
 |
|---|
| LysN LTQ |
 |
|---|
| TryLysC LTQ |
 |
|---|
| Try MSlow |
 |
|---|
| ChTry MSlow |
 |
|---|
| ArgC MSlow |
 |
|---|
| LysN MSlow |
 |
|---|
| TryLysC MSlow |
 |
|---|
| Try MShigh |
 |
|---|
| ChTry MShigh |
 |
|---|
| ArgC MShigh |
 |
|---|
| LysN MShigh |
 |
|---|
| TryLysC MShigh |
 |
|---|
General Statistics
Number of major isoforms |
Number of additional isoforms |
Number of all proteins |
Number of amino acids |
Min. Seq. Length |
Max. Seq. Length |
Avg. Seq. Length |
Avg. Mol. Weight |
|---|---|---|---|---|---|---|---|
0 |
1012518 |
31 |
2310 |
330.0 |
35.79 |
Amino acid frequency
Ala |
Cys |
Asp |
Glu |
Phe |
Gly |
His |
Ile |
Lys |
Leu |
|---|---|---|---|---|---|---|---|---|---|
13.395 ± 0.072 | 0.795 ± 0.015 |
5.682 ± 0.037 | 5.804 ± 0.046 |
3.231 ± 0.029 | 8.971 ± 0.035 |
2.185 ± 0.022 | 3.709 ± 0.036 |
2.355 ± 0.039 | 11.022 ± 0.058 |
Met |
Asn |
Gln |
Pro |
Arg |
Ser |
Thr |
Val |
Trp |
Tyr |
|---|---|---|---|---|---|---|---|---|---|
2.143 ± 0.021 | 2.244 ± 0.024 |
5.743 ± 0.038 | 3.707 ± 0.027 |
8.155 ± 0.045 | 4.836 ± 0.029 |
4.494 ± 0.028 | 7.679 ± 0.037 |
1.6 ± 0.023 | 2.248 ± 0.025 |
Most of the basic statistics you can see at this page can be downloaded from this CSV file
Proteome-pI is available under Creative Commons Attribution-NoDerivs license, for more details see here
| Reference: Kozlowski LP. Proteome-pI 2.0: Proteome Isoelectric Point Database Update. Nucleic Acids Res. 2021, doi: 10.1093/nar/gkab944 | Contact: Lukasz P. Kozlowski |
