Aureibacillus halotolerans
Taxonomy: cellular organisms; Bacteria; Terrabacteria group; Firmicutes; Bacilli; Bacillales; Bacillaceae; Aureibacillus
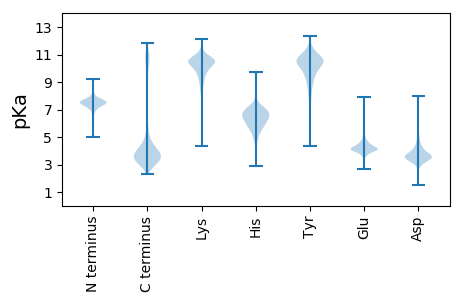
Average proteome isoelectric point is 6.17
Get precalculated fractions of proteins

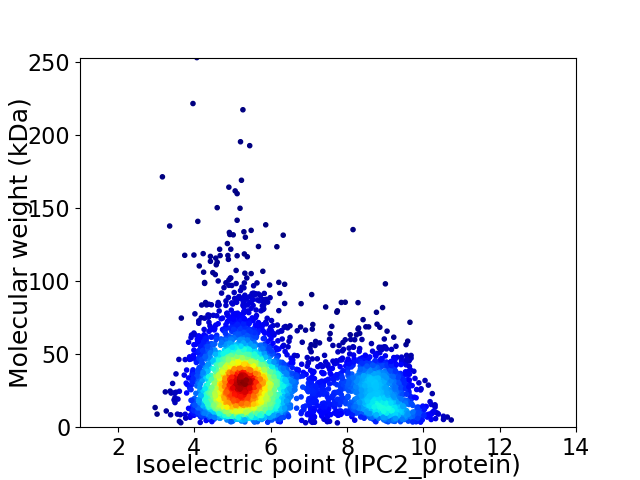
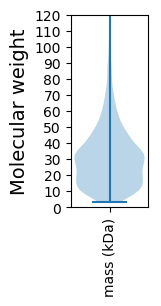
Virtual 2D-PAGE plot for 4165 proteins (isoelectric point calculated using IPC2_protein)
Get csv file with sequences according to given criteria:
* You can choose from 21 different methods for calculating isoelectric point
Summary statistics related to proteome-wise predictions


Protein with the lowest isoelectric point:
>tr|A0A4R6TTI9|A0A4R6TTI9_9BACI ArsR family transcriptional regulator OS=Aureibacillus halotolerans OX=1508390 GN=EV213_11775 PE=4 SV=1
MM1 pKa = 7.26KK2 pKa = 10.13QRR4 pKa = 11.84GWIMVIVLAIVVVGFIAIVVLNNQSNGSNANGGSGMYY41 pKa = 9.09TGQGDD46 pKa = 3.93PEE48 pKa = 4.46AFAEE52 pKa = 4.93LYY54 pKa = 10.62SEE56 pKa = 4.26QPVLGDD62 pKa = 3.28EE63 pKa = 4.26NAPVQIVQFGDD74 pKa = 3.91YY75 pKa = 10.31KK76 pKa = 11.25CPACKK81 pKa = 10.21NFEE84 pKa = 4.15EE85 pKa = 4.27QLVPIIKK92 pKa = 9.77QEE94 pKa = 3.95YY95 pKa = 8.36VDD97 pKa = 3.39TGKK100 pKa = 10.68AQFYY104 pKa = 9.59FMNYY108 pKa = 9.19PFLGDD113 pKa = 3.77DD114 pKa = 3.65AAILASYY121 pKa = 10.75AEE123 pKa = 4.32AVYY126 pKa = 8.67ATLGNDD132 pKa = 4.12AFWTYY137 pKa = 11.16NSAVYY142 pKa = 9.61EE143 pKa = 4.18RR144 pKa = 11.84QGDD147 pKa = 3.68EE148 pKa = 3.73RR149 pKa = 11.84LAWGNDD155 pKa = 3.1EE156 pKa = 5.02FNQTLIQEE164 pKa = 4.63LFSEE168 pKa = 4.78EE169 pKa = 4.24EE170 pKa = 3.83ATQVLEE176 pKa = 4.6AYY178 pKa = 9.66EE179 pKa = 4.59SGDD182 pKa = 3.37FADD185 pKa = 4.47IVADD189 pKa = 4.18EE190 pKa = 4.35KK191 pKa = 11.6AFAEE195 pKa = 4.43SQGVTGTPSLFINGKK210 pKa = 9.02KK211 pKa = 10.01VEE213 pKa = 4.21MDD215 pKa = 3.31NLEE218 pKa = 4.12QVADD222 pKa = 4.04LNKK225 pKa = 10.3LVEE228 pKa = 4.3EE229 pKa = 4.55AATNGG234 pKa = 3.44
MM1 pKa = 7.26KK2 pKa = 10.13QRR4 pKa = 11.84GWIMVIVLAIVVVGFIAIVVLNNQSNGSNANGGSGMYY41 pKa = 9.09TGQGDD46 pKa = 3.93PEE48 pKa = 4.46AFAEE52 pKa = 4.93LYY54 pKa = 10.62SEE56 pKa = 4.26QPVLGDD62 pKa = 3.28EE63 pKa = 4.26NAPVQIVQFGDD74 pKa = 3.91YY75 pKa = 10.31KK76 pKa = 11.25CPACKK81 pKa = 10.21NFEE84 pKa = 4.15EE85 pKa = 4.27QLVPIIKK92 pKa = 9.77QEE94 pKa = 3.95YY95 pKa = 8.36VDD97 pKa = 3.39TGKK100 pKa = 10.68AQFYY104 pKa = 9.59FMNYY108 pKa = 9.19PFLGDD113 pKa = 3.77DD114 pKa = 3.65AAILASYY121 pKa = 10.75AEE123 pKa = 4.32AVYY126 pKa = 8.67ATLGNDD132 pKa = 4.12AFWTYY137 pKa = 11.16NSAVYY142 pKa = 9.61EE143 pKa = 4.18RR144 pKa = 11.84QGDD147 pKa = 3.68EE148 pKa = 3.73RR149 pKa = 11.84LAWGNDD155 pKa = 3.1EE156 pKa = 5.02FNQTLIQEE164 pKa = 4.63LFSEE168 pKa = 4.78EE169 pKa = 4.24EE170 pKa = 3.83ATQVLEE176 pKa = 4.6AYY178 pKa = 9.66EE179 pKa = 4.59SGDD182 pKa = 3.37FADD185 pKa = 4.47IVADD189 pKa = 4.18EE190 pKa = 4.35KK191 pKa = 11.6AFAEE195 pKa = 4.43SQGVTGTPSLFINGKK210 pKa = 9.02KK211 pKa = 10.01VEE213 pKa = 4.21MDD215 pKa = 3.31NLEE218 pKa = 4.12QVADD222 pKa = 4.04LNKK225 pKa = 10.3LVEE228 pKa = 4.3EE229 pKa = 4.55AATNGG234 pKa = 3.44
Molecular weight: 25.7 kDa
Isoelectric point according different methods:
Protein with the highest isoelectric point:
>tr|A0A4R6U5G4|A0A4R6U5G4_9BACI L-rhamnose isomerase/sugar isomerase OS=Aureibacillus halotolerans OX=1508390 GN=EV213_11012 PE=4 SV=1
MM1 pKa = 7.45KK2 pKa = 10.14RR3 pKa = 11.84RR4 pKa = 11.84AEE6 pKa = 4.07HH7 pKa = 6.01PQTGKK12 pKa = 9.8WFFHH16 pKa = 6.33FSRR19 pKa = 11.84LEE21 pKa = 3.49ISVPQFQRR29 pKa = 11.84AAAGQRR35 pKa = 11.84KK36 pKa = 9.27AEE38 pKa = 4.11RR39 pKa = 11.84RR40 pKa = 11.84CTEE43 pKa = 3.64AQVRR47 pKa = 11.84TSSGRR52 pKa = 11.84EE53 pKa = 3.73MVLHH57 pKa = 6.67ISLARR62 pKa = 11.84GFLRR66 pKa = 11.84RR67 pKa = 11.84SFYY70 pKa = 10.8GAQLAKK76 pKa = 10.62KK77 pKa = 9.86SGAPCASIRR86 pKa = 11.84IIPKK90 pKa = 9.04PRR92 pKa = 11.84NGSPISRR99 pKa = 11.84FGDD102 pKa = 3.3VFCIKK107 pKa = 9.69EE108 pKa = 4.15PCHH111 pKa = 6.31IPCSLDD117 pKa = 3.25NASPQPYY124 pKa = 9.85LHH126 pKa = 7.2LILNHH131 pKa = 5.73FRR133 pKa = 11.84TFEE136 pKa = 3.96WSSATQEE143 pKa = 4.24SQALMTLYY151 pKa = 10.81SKK153 pKa = 10.93VEE155 pKa = 3.77PEE157 pKa = 3.68RR158 pKa = 11.84RR159 pKa = 11.84PFF161 pKa = 3.67
MM1 pKa = 7.45KK2 pKa = 10.14RR3 pKa = 11.84RR4 pKa = 11.84AEE6 pKa = 4.07HH7 pKa = 6.01PQTGKK12 pKa = 9.8WFFHH16 pKa = 6.33FSRR19 pKa = 11.84LEE21 pKa = 3.49ISVPQFQRR29 pKa = 11.84AAAGQRR35 pKa = 11.84KK36 pKa = 9.27AEE38 pKa = 4.11RR39 pKa = 11.84RR40 pKa = 11.84CTEE43 pKa = 3.64AQVRR47 pKa = 11.84TSSGRR52 pKa = 11.84EE53 pKa = 3.73MVLHH57 pKa = 6.67ISLARR62 pKa = 11.84GFLRR66 pKa = 11.84RR67 pKa = 11.84SFYY70 pKa = 10.8GAQLAKK76 pKa = 10.62KK77 pKa = 9.86SGAPCASIRR86 pKa = 11.84IIPKK90 pKa = 9.04PRR92 pKa = 11.84NGSPISRR99 pKa = 11.84FGDD102 pKa = 3.3VFCIKK107 pKa = 9.69EE108 pKa = 4.15PCHH111 pKa = 6.31IPCSLDD117 pKa = 3.25NASPQPYY124 pKa = 9.85LHH126 pKa = 7.2LILNHH131 pKa = 5.73FRR133 pKa = 11.84TFEE136 pKa = 3.96WSSATQEE143 pKa = 4.24SQALMTLYY151 pKa = 10.81SKK153 pKa = 10.93VEE155 pKa = 3.77PEE157 pKa = 3.68RR158 pKa = 11.84RR159 pKa = 11.84PFF161 pKa = 3.67
Molecular weight: 18.46 kDa
Isoelectric point according different methods:
Peptides (in silico digests for buttom-up proteomics)
Below you can find in silico digests of the whole proteome with Trypsin, Chymotrypsin, Trypsin+LysC, LysN, ArgC proteases suitable for different mass spec machines.| Try ESI |
 |
|---|
| ChTry ESI |
 |
|---|
| ArgC ESI |
 |
|---|
| LysN ESI |
 |
|---|
| TryLysC ESI |
 |
|---|
| Try MALDI |
 |
|---|
| ChTry MALDI |
 |
|---|
| ArgC MALDI |
 |
|---|
| LysN MALDI |
 |
|---|
| TryLysC MALDI |
 |
|---|
| Try LTQ |
 |
|---|
| ChTry LTQ |
 |
|---|
| ArgC LTQ |
 |
|---|
| LysN LTQ |
 |
|---|
| TryLysC LTQ |
 |
|---|
| Try MSlow |
 |
|---|
| ChTry MSlow |
 |
|---|
| ArgC MSlow |
 |
|---|
| LysN MSlow |
 |
|---|
| TryLysC MSlow |
 |
|---|
| Try MShigh |
 |
|---|
| ChTry MShigh |
 |
|---|
| ArgC MShigh |
 |
|---|
| LysN MShigh |
 |
|---|
| TryLysC MShigh |
 |
|---|
General Statistics
Number of major isoforms |
Number of additional isoforms |
Number of all proteins |
Number of amino acids |
Min. Seq. Length |
Max. Seq. Length |
Avg. Seq. Length |
Avg. Mol. Weight |
|---|---|---|---|---|---|---|---|
0 |
1211138 |
25 |
2337 |
290.8 |
32.5 |
Amino acid frequency
Ala |
Cys |
Asp |
Glu |
Phe |
Gly |
His |
Ile |
Lys |
Leu |
|---|---|---|---|---|---|---|---|---|---|
7.956 ± 0.038 | 0.754 ± 0.011 |
5.342 ± 0.036 | 7.244 ± 0.047 |
4.401 ± 0.027 | 6.829 ± 0.032 |
2.387 ± 0.022 | 6.53 ± 0.035 |
5.48 ± 0.029 | 9.969 ± 0.044 |
Met |
Asn |
Gln |
Pro |
Arg |
Ser |
Thr |
Val |
Trp |
Tyr |
|---|---|---|---|---|---|---|---|---|---|
2.824 ± 0.019 | 3.746 ± 0.025 |
3.938 ± 0.04 | 4.207 ± 0.027 |
4.483 ± 0.028 | 6.254 ± 0.029 |
5.865 ± 0.032 | 7.292 ± 0.047 |
1.233 ± 0.017 | 3.265 ± 0.026 |
Most of the basic statistics you can see at this page can be downloaded from this CSV file
Proteome-pI is available under Creative Commons Attribution-NoDerivs license, for more details see here
| Reference: Kozlowski LP. Proteome-pI 2.0: Proteome Isoelectric Point Database Update. Nucleic Acids Res. 2021, doi: 10.1093/nar/gkab944 | Contact: Lukasz P. Kozlowski |
