Photobacterium halotolerans
Taxonomy: cellular organisms; Bacteria; Proteobacteria; Gammaproteobacteria; Vibrionales; Vibrionaceae; Photobacterium
Average proteome isoelectric point is 6.06
Get precalculated fractions of proteins

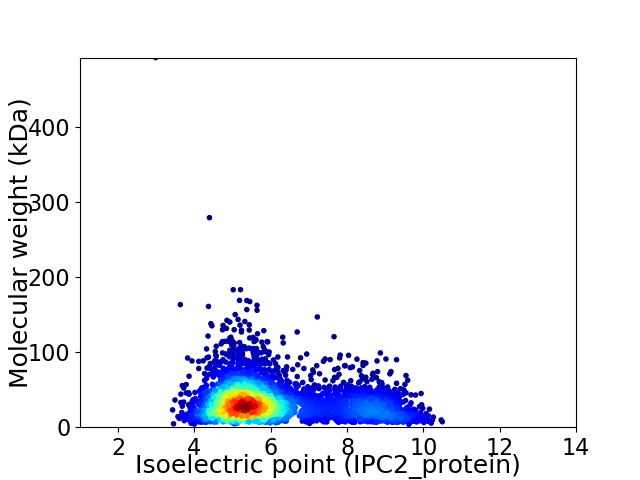
Virtual 2D-PAGE plot for 3968 proteins (isoelectric point calculated using IPC2_protein)
Get csv file with sequences according to given criteria:
* You can choose from 21 different methods for calculating isoelectric point
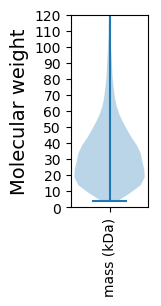
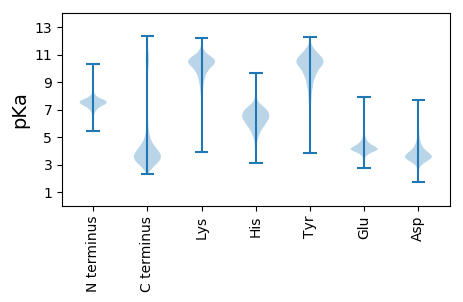
Summary statistics related to proteome-wise predictions


Protein with the lowest isoelectric point:
>tr|A0A0F5VC46|A0A0F5VC46_9GAMM Sensor protein OS=Photobacterium halotolerans OX=265726 GN=KY46_15130 PE=4 SV=1
MM1 pKa = 7.39KK2 pKa = 8.62QTKK5 pKa = 8.17MLSMVLLSLMLTACGGDD22 pKa = 3.27STGPVINQDD31 pKa = 3.17NLMNNSNTTSNNDD44 pKa = 3.25TSHH47 pKa = 6.88SDD49 pKa = 3.06SDD51 pKa = 3.88TTTSIDD57 pKa = 2.99IDD59 pKa = 4.41GIYY62 pKa = 10.53VDD64 pKa = 3.51VDD66 pKa = 3.61NNVVMMVDD74 pKa = 3.9EE75 pKa = 4.52DD76 pKa = 4.39TEE78 pKa = 4.99DD79 pKa = 3.38GGFVLLDD86 pKa = 3.62TDD88 pKa = 4.16DD89 pKa = 4.08SAVVMNTSHH98 pKa = 7.04TISGTRR104 pKa = 11.84MTATGISYY112 pKa = 10.37LSSSAYY118 pKa = 9.39SMNMEE123 pKa = 4.87DD124 pKa = 4.93SVTLTFYY131 pKa = 10.28RR132 pKa = 11.84QSVSFMGVINDD143 pKa = 3.48QLTSYY148 pKa = 11.29SLDD151 pKa = 3.6RR152 pKa = 11.84NSGSLSLEE160 pKa = 4.31TLDD163 pKa = 3.66GTYY166 pKa = 10.59TNSEE170 pKa = 4.06TGDD173 pKa = 3.53TFSIDD178 pKa = 3.12VAGNFTINGGCTISGTVYY196 pKa = 10.18QKK198 pKa = 10.32KK199 pKa = 9.77HH200 pKa = 5.54YY201 pKa = 9.78YY202 pKa = 9.79RR203 pKa = 11.84DD204 pKa = 3.54DD205 pKa = 3.76AASVTGCSDD214 pKa = 3.03ATFDD218 pKa = 4.23RR219 pKa = 11.84DD220 pKa = 3.55DD221 pKa = 3.53YY222 pKa = 11.83QFILFTLIVGDD233 pKa = 3.64TNYY236 pKa = 10.81LVTIADD242 pKa = 3.81SSVATLWRR250 pKa = 11.84LMPLEE255 pKa = 4.2EE256 pKa = 4.21TLL258 pKa = 4.22
MM1 pKa = 7.39KK2 pKa = 8.62QTKK5 pKa = 8.17MLSMVLLSLMLTACGGDD22 pKa = 3.27STGPVINQDD31 pKa = 3.17NLMNNSNTTSNNDD44 pKa = 3.25TSHH47 pKa = 6.88SDD49 pKa = 3.06SDD51 pKa = 3.88TTTSIDD57 pKa = 2.99IDD59 pKa = 4.41GIYY62 pKa = 10.53VDD64 pKa = 3.51VDD66 pKa = 3.61NNVVMMVDD74 pKa = 3.9EE75 pKa = 4.52DD76 pKa = 4.39TEE78 pKa = 4.99DD79 pKa = 3.38GGFVLLDD86 pKa = 3.62TDD88 pKa = 4.16DD89 pKa = 4.08SAVVMNTSHH98 pKa = 7.04TISGTRR104 pKa = 11.84MTATGISYY112 pKa = 10.37LSSSAYY118 pKa = 9.39SMNMEE123 pKa = 4.87DD124 pKa = 4.93SVTLTFYY131 pKa = 10.28RR132 pKa = 11.84QSVSFMGVINDD143 pKa = 3.48QLTSYY148 pKa = 11.29SLDD151 pKa = 3.6RR152 pKa = 11.84NSGSLSLEE160 pKa = 4.31TLDD163 pKa = 3.66GTYY166 pKa = 10.59TNSEE170 pKa = 4.06TGDD173 pKa = 3.53TFSIDD178 pKa = 3.12VAGNFTINGGCTISGTVYY196 pKa = 10.18QKK198 pKa = 10.32KK199 pKa = 9.77HH200 pKa = 5.54YY201 pKa = 9.78YY202 pKa = 9.79RR203 pKa = 11.84DD204 pKa = 3.54DD205 pKa = 3.76AASVTGCSDD214 pKa = 3.03ATFDD218 pKa = 4.23RR219 pKa = 11.84DD220 pKa = 3.55DD221 pKa = 3.53YY222 pKa = 11.83QFILFTLIVGDD233 pKa = 3.64TNYY236 pKa = 10.81LVTIADD242 pKa = 3.81SSVATLWRR250 pKa = 11.84LMPLEE255 pKa = 4.2EE256 pKa = 4.21TLL258 pKa = 4.22
Molecular weight: 28.0 kDa
Isoelectric point according different methods:
Protein with the highest isoelectric point:
>tr|A0A0F5VG69|A0A0F5VG69_9GAMM Fis family transcriptional regulator OS=Photobacterium halotolerans OX=265726 GN=KY46_05270 PE=4 SV=1
MM1 pKa = 7.29PCLWLFVNCSFSKK14 pKa = 10.66VDD16 pKa = 3.65EE17 pKa = 4.62KK18 pKa = 11.31LLSEE22 pKa = 4.65NKK24 pKa = 8.94PEE26 pKa = 3.61IRR28 pKa = 11.84VFHH31 pKa = 5.88CHH33 pKa = 6.25RR34 pKa = 11.84EE35 pKa = 3.81RR36 pKa = 11.84FRR38 pKa = 11.84TNFQVVGAGSAYY50 pKa = 10.11NRR52 pKa = 11.84PGQQQRR58 pKa = 11.84TKK60 pKa = 10.64RR61 pKa = 11.84GFLGTLCTHH70 pKa = 6.92KK71 pKa = 10.66AYY73 pKa = 10.58LVRR76 pKa = 11.84VQRR79 pKa = 11.84CRR81 pKa = 11.84DD82 pKa = 3.02KK83 pKa = 11.17RR84 pKa = 11.84RR85 pKa = 11.84AQVRR89 pKa = 11.84KK90 pKa = 9.2ISNPSRR96 pKa = 11.84LALVIWIAIGEE107 pKa = 4.47SMTGRR112 pKa = 11.84VYY114 pKa = 10.74FLSSNARR121 pKa = 11.84QTQGKK126 pKa = 8.85IGSEE130 pKa = 4.32FFPGSYY136 pKa = 10.06ILLKK140 pKa = 10.83LL141 pKa = 3.73
MM1 pKa = 7.29PCLWLFVNCSFSKK14 pKa = 10.66VDD16 pKa = 3.65EE17 pKa = 4.62KK18 pKa = 11.31LLSEE22 pKa = 4.65NKK24 pKa = 8.94PEE26 pKa = 3.61IRR28 pKa = 11.84VFHH31 pKa = 5.88CHH33 pKa = 6.25RR34 pKa = 11.84EE35 pKa = 3.81RR36 pKa = 11.84FRR38 pKa = 11.84TNFQVVGAGSAYY50 pKa = 10.11NRR52 pKa = 11.84PGQQQRR58 pKa = 11.84TKK60 pKa = 10.64RR61 pKa = 11.84GFLGTLCTHH70 pKa = 6.92KK71 pKa = 10.66AYY73 pKa = 10.58LVRR76 pKa = 11.84VQRR79 pKa = 11.84CRR81 pKa = 11.84DD82 pKa = 3.02KK83 pKa = 11.17RR84 pKa = 11.84RR85 pKa = 11.84AQVRR89 pKa = 11.84KK90 pKa = 9.2ISNPSRR96 pKa = 11.84LALVIWIAIGEE107 pKa = 4.47SMTGRR112 pKa = 11.84VYY114 pKa = 10.74FLSSNARR121 pKa = 11.84QTQGKK126 pKa = 8.85IGSEE130 pKa = 4.32FFPGSYY136 pKa = 10.06ILLKK140 pKa = 10.83LL141 pKa = 3.73
Molecular weight: 16.3 kDa
Isoelectric point according different methods:
Peptides (in silico digests for buttom-up proteomics)
Below you can find in silico digests of the whole proteome with Trypsin, Chymotrypsin, Trypsin+LysC, LysN, ArgC proteases suitable for different mass spec machines.| Try ESI |
 |
|---|
| ChTry ESI |
 |
|---|
| ArgC ESI |
 |
|---|
| LysN ESI |
 |
|---|
| TryLysC ESI |
 |
|---|
| Try MALDI |
 |
|---|
| ChTry MALDI |
 |
|---|
| ArgC MALDI |
 |
|---|
| LysN MALDI |
 |
|---|
| TryLysC MALDI |
 |
|---|
| Try LTQ |
 |
|---|
| ChTry LTQ |
 |
|---|
| ArgC LTQ |
 |
|---|
| LysN LTQ |
 |
|---|
| TryLysC LTQ |
 |
|---|
| Try MSlow |
 |
|---|
| ChTry MSlow |
 |
|---|
| ArgC MSlow |
 |
|---|
| LysN MSlow |
 |
|---|
| TryLysC MSlow |
 |
|---|
| Try MShigh |
 |
|---|
| ChTry MShigh |
 |
|---|
| ArgC MShigh |
 |
|---|
| LysN MShigh |
 |
|---|
| TryLysC MShigh |
 |
|---|
General Statistics
Number of major isoforms |
Number of additional isoforms |
Number of all proteins |
Number of amino acids |
Min. Seq. Length |
Max. Seq. Length |
Avg. Seq. Length |
Avg. Mol. Weight |
|---|---|---|---|---|---|---|---|
1261788 |
31 |
4794 |
318.0 |
35.2 |
Amino acid frequency
Ala |
Cys |
Asp |
Glu |
Phe |
Gly |
His |
Ile |
Lys |
Leu |
|---|---|---|---|---|---|---|---|---|---|
9.495 ± 0.043 | 1.061 ± 0.015 |
5.593 ± 0.04 | 5.949 ± 0.042 |
3.974 ± 0.029 | 7.073 ± 0.036 |
2.341 ± 0.023 | 5.791 ± 0.03 |
4.444 ± 0.036 | 10.735 ± 0.048 |
Met |
Asn |
Gln |
Pro |
Arg |
Ser |
Thr |
Val |
Trp |
Tyr |
|---|---|---|---|---|---|---|---|---|---|
2.733 ± 0.021 | 3.686 ± 0.026 |
4.25 ± 0.022 | 4.919 ± 0.032 |
5.038 ± 0.038 | 6.293 ± 0.027 |
5.33 ± 0.034 | 7.04 ± 0.035 |
1.312 ± 0.015 | 2.943 ± 0.025 |
Most of the basic statistics you can see at this page can be downloaded from this CSV file
Proteome-pI is available under Creative Commons Attribution-NoDerivs license, for more details see here
| Reference: Kozlowski LP. Proteome-pI 2.0: Proteome Isoelectric Point Database Update. Nucleic Acids Res. 2021, doi: 10.1093/nar/gkab944 | Contact: Lukasz P. Kozlowski |
