Beet virus Q
Taxonomy: Viruses; Riboviria; Orthornavirae; Kitrinoviricota; Alsuviricetes; Martellivirales; Virgaviridae; Pomovirus
Average proteome isoelectric point is 6.45
Get precalculated fractions of proteins

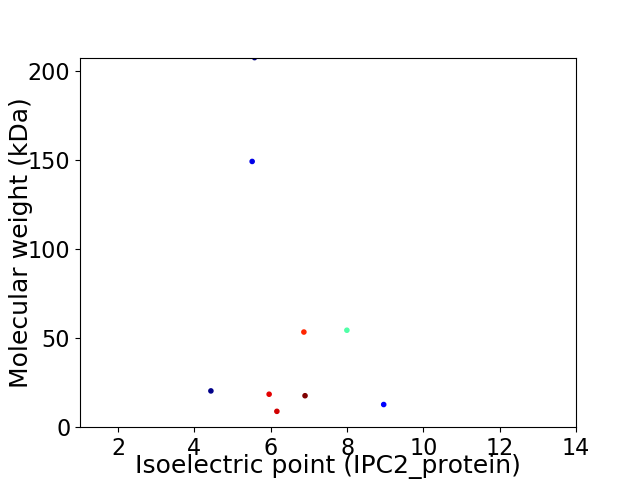
Virtual 2D-PAGE plot for 9 proteins (isoelectric point calculated using IPC2_protein)
Get csv file with sequences according to given criteria:
* You can choose from 21 different methods for calculating isoelectric point
Summary statistics related to proteome-wise predictions


Protein with the lowest isoelectric point:
>tr|Q9WKC1|Q9WKC1_9VIRU Capsid protein OS=Beet virus Q OX=71972 PE=4 SV=1
MM1 pKa = 8.04DD2 pKa = 5.48PPVIEE7 pKa = 5.08HH8 pKa = 6.73SQDD11 pKa = 3.43CCCQHH16 pKa = 6.94CSWQPPCTPTCAGLNRR32 pKa = 11.84NAMSHH37 pKa = 4.96VEE39 pKa = 4.17EE40 pKa = 3.89IVRR43 pKa = 11.84RR44 pKa = 11.84EE45 pKa = 3.73EE46 pKa = 4.16SSFSLSYY53 pKa = 10.89VALCCVVCLLLGVTFSLYY71 pKa = 10.37LKK73 pKa = 10.58SGAEE77 pKa = 4.02VDD79 pKa = 3.89SSAFSYY85 pKa = 10.69YY86 pKa = 10.4YY87 pKa = 10.3QDD89 pKa = 3.83LNSVEE94 pKa = 4.43VKK96 pKa = 10.18IGSYY100 pKa = 10.4PIDD103 pKa = 3.75PEE105 pKa = 4.12IIKK108 pKa = 10.35AIHH111 pKa = 6.47HH112 pKa = 5.52FQEE115 pKa = 4.49APFGVSLSQSDD126 pKa = 4.2DD127 pKa = 3.65SDD129 pKa = 4.01VDD131 pKa = 3.85DD132 pKa = 4.89VPDD135 pKa = 3.57VAEE138 pKa = 4.81LALQIDD144 pKa = 5.02RR145 pKa = 11.84LTLSCVVFEE154 pKa = 5.48FIEE157 pKa = 4.2KK158 pKa = 9.12LCYY161 pKa = 10.07RR162 pKa = 11.84FFCVCLVVFCFYY174 pKa = 10.78CYY176 pKa = 10.41FHH178 pKa = 7.17FCC180 pKa = 4.65
MM1 pKa = 8.04DD2 pKa = 5.48PPVIEE7 pKa = 5.08HH8 pKa = 6.73SQDD11 pKa = 3.43CCCQHH16 pKa = 6.94CSWQPPCTPTCAGLNRR32 pKa = 11.84NAMSHH37 pKa = 4.96VEE39 pKa = 4.17EE40 pKa = 3.89IVRR43 pKa = 11.84RR44 pKa = 11.84EE45 pKa = 3.73EE46 pKa = 4.16SSFSLSYY53 pKa = 10.89VALCCVVCLLLGVTFSLYY71 pKa = 10.37LKK73 pKa = 10.58SGAEE77 pKa = 4.02VDD79 pKa = 3.89SSAFSYY85 pKa = 10.69YY86 pKa = 10.4YY87 pKa = 10.3QDD89 pKa = 3.83LNSVEE94 pKa = 4.43VKK96 pKa = 10.18IGSYY100 pKa = 10.4PIDD103 pKa = 3.75PEE105 pKa = 4.12IIKK108 pKa = 10.35AIHH111 pKa = 6.47HH112 pKa = 5.52FQEE115 pKa = 4.49APFGVSLSQSDD126 pKa = 4.2DD127 pKa = 3.65SDD129 pKa = 4.01VDD131 pKa = 3.85DD132 pKa = 4.89VPDD135 pKa = 3.57VAEE138 pKa = 4.81LALQIDD144 pKa = 5.02RR145 pKa = 11.84LTLSCVVFEE154 pKa = 5.48FIEE157 pKa = 4.2KK158 pKa = 9.12LCYY161 pKa = 10.07RR162 pKa = 11.84FFCVCLVVFCFYY174 pKa = 10.78CYY176 pKa = 10.41FHH178 pKa = 7.17FCC180 pKa = 4.65
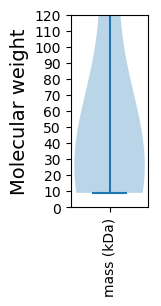
Molecular weight: 20.36 kDa
Isoelectric point according different methods:
Protein with the highest isoelectric point:
>tr|O92518|O92518_9VIRU Third triple gene block protein OS=Beet virus Q OX=71972 PE=4 SV=1
MM1 pKa = 6.96VRR3 pKa = 11.84SNVVGARR10 pKa = 11.84PNIYY14 pKa = 8.63WPIVVGVVAIALFGFLTITNQKK36 pKa = 10.31HH37 pKa = 4.31STQSGDD43 pKa = 3.87NIHH46 pKa = 6.78KK47 pKa = 9.44FANGGSYY54 pKa = 11.29ADD56 pKa = 3.41GSKK59 pKa = 10.5RR60 pKa = 11.84INYY63 pKa = 7.88NKK65 pKa = 10.16NNCRR69 pKa = 11.84AYY71 pKa = 10.64NGSSSNRR78 pKa = 11.84TFTGLLLPALFLAAALYY95 pKa = 10.29AYY97 pKa = 9.41VCWSKK102 pKa = 10.52PKK104 pKa = 10.51CHH106 pKa = 4.95VTCRR110 pKa = 11.84GDD112 pKa = 3.38CAAGGEE118 pKa = 4.28
MM1 pKa = 6.96VRR3 pKa = 11.84SNVVGARR10 pKa = 11.84PNIYY14 pKa = 8.63WPIVVGVVAIALFGFLTITNQKK36 pKa = 10.31HH37 pKa = 4.31STQSGDD43 pKa = 3.87NIHH46 pKa = 6.78KK47 pKa = 9.44FANGGSYY54 pKa = 11.29ADD56 pKa = 3.41GSKK59 pKa = 10.5RR60 pKa = 11.84INYY63 pKa = 7.88NKK65 pKa = 10.16NNCRR69 pKa = 11.84AYY71 pKa = 10.64NGSSSNRR78 pKa = 11.84TFTGLLLPALFLAAALYY95 pKa = 10.29AYY97 pKa = 9.41VCWSKK102 pKa = 10.52PKK104 pKa = 10.51CHH106 pKa = 4.95VTCRR110 pKa = 11.84GDD112 pKa = 3.38CAAGGEE118 pKa = 4.28
Molecular weight: 12.72 kDa
Isoelectric point according different methods:
Peptides (in silico digests for buttom-up proteomics)
Below you can find in silico digests of the whole proteome with Trypsin, Chymotrypsin, Trypsin+LysC, LysN, ArgC proteases suitable for different mass spec machines.| Try ESI |
 |
|---|
| ChTry ESI |
 |
|---|
| ArgC ESI |
 |
|---|
| LysN ESI |
 |
|---|
| TryLysC ESI |
 |
|---|
| Try MALDI |
 |
|---|
| ChTry MALDI |
 |
|---|
| ArgC MALDI |
 |
|---|
| LysN MALDI |
 |
|---|
| TryLysC MALDI |
 |
|---|
| Try LTQ |
 |
|---|
| ChTry LTQ |
 |
|---|
| ArgC LTQ |
 |
|---|
| LysN LTQ |
 |
|---|
| TryLysC LTQ |
 |
|---|
| Try MSlow |
 |
|---|
| ChTry MSlow |
 |
|---|
| ArgC MSlow |
 |
|---|
| LysN MSlow |
 |
|---|
| TryLysC MSlow |
 |
|---|
| Try MShigh |
 |
|---|
| ChTry MShigh |
 |
|---|
| ArgC MShigh |
 |
|---|
| LysN MShigh |
 |
|---|
| TryLysC MShigh |
 |
|---|
General Statistics
Number of major isoforms |
Number of additional isoforms |
Number of all proteins |
Number of amino acids |
Min. Seq. Length |
Max. Seq. Length |
Avg. Seq. Length |
Avg. Mol. Weight |
|---|---|---|---|---|---|---|---|
0 |
4809 |
81 |
1818 |
534.3 |
60.26 |
Amino acid frequency
Ala |
Cys |
Asp |
Glu |
Phe |
Gly |
His |
Ile |
Lys |
Leu |
|---|---|---|---|---|---|---|---|---|---|
6.529 ± 0.864 | 2.475 ± 0.512 |
6.717 ± 0.63 | 7.278 ± 0.562 |
4.367 ± 0.335 | 6.114 ± 0.454 |
2.412 ± 0.159 | 4.866 ± 0.256 |
6.821 ± 0.696 | 8.921 ± 0.287 |
Met |
Asn |
Gln |
Pro |
Arg |
Ser |
Thr |
Val |
Trp |
Tyr |
|---|---|---|---|---|---|---|---|---|---|
2.641 ± 0.539 | 3.847 ± 0.334 |
3.098 ± 0.213 | 2.932 ± 0.17 |
5.906 ± 0.411 | 7.632 ± 1.104 |
5.407 ± 0.231 | 7.673 ± 0.216 |
0.998 ± 0.154 | 3.327 ± 0.312 |
Most of the basic statistics you can see at this page can be downloaded from this CSV file
Proteome-pI is available under Creative Commons Attribution-NoDerivs license, for more details see here
| Reference: Kozlowski LP. Proteome-pI 2.0: Proteome Isoelectric Point Database Update. Nucleic Acids Res. 2021, doi: 10.1093/nar/gkab944 | Contact: Lukasz P. Kozlowski |
