Sitophilus oryzae (Rice weevil) (Curculio oryzae)
Taxonomy: cellular organisms; Eukaryota; Opisthokonta; Metazoa; Eumetazoa; Bilateria; Protostomia; Ecdysozoa; Panarthropoda; Arthropoda; Mandibulata; Pancrustacea; Hexapoda; Insecta; Dicondylia; Pterygota; Neoptera; Endopterygota; Coleoptera; Polyphaga; Cucujiformia; Curculionoidea; Curculionidae; Dryophthorinae;
Average proteome isoelectric point is 6.76
Get precalculated fractions of proteins

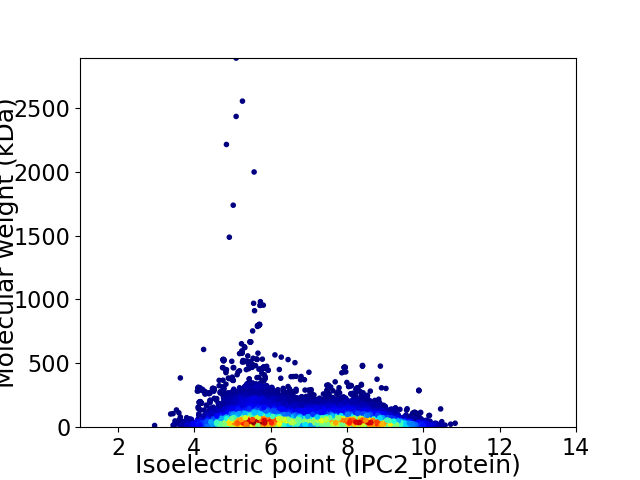
Virtual 2D-PAGE plot for 20351 proteins (isoelectric point calculated using IPC2_protein)
Get csv file with sequences according to given criteria:
* You can choose from 21 different methods for calculating isoelectric point
Summary statistics related to proteome-wise predictions


Protein with the lowest isoelectric point:
>tr|A0A6J2YXW3|A0A6J2YXW3_SITOR uncharacterized protein LOC115891686 OS=Sitophilus oryzae OX=7048 GN=LOC115891686 PE=4 SV=1
MM1 pKa = 7.42KK2 pKa = 10.47SSLALLVVVYY12 pKa = 10.35LMHH15 pKa = 6.51TSMVVLEE22 pKa = 4.53VKK24 pKa = 10.15SAPFGFGLLCDD35 pKa = 4.75DD36 pKa = 5.7YY37 pKa = 11.94EE38 pKa = 6.21DD39 pKa = 4.49LLCDD43 pKa = 4.61FFDD46 pKa = 3.71MCEE49 pKa = 4.21DD50 pKa = 4.57DD51 pKa = 4.94SDD53 pKa = 4.09EE54 pKa = 4.47TTTPPPSPTTSTEE67 pKa = 3.85KK68 pKa = 10.37PSPSTQSSPITTITTTVNPITTTTVAPTTSVAPTTTVAPTPP109 pKa = 3.84
MM1 pKa = 7.42KK2 pKa = 10.47SSLALLVVVYY12 pKa = 10.35LMHH15 pKa = 6.51TSMVVLEE22 pKa = 4.53VKK24 pKa = 10.15SAPFGFGLLCDD35 pKa = 4.75DD36 pKa = 5.7YY37 pKa = 11.94EE38 pKa = 6.21DD39 pKa = 4.49LLCDD43 pKa = 4.61FFDD46 pKa = 3.71MCEE49 pKa = 4.21DD50 pKa = 4.57DD51 pKa = 4.94SDD53 pKa = 4.09EE54 pKa = 4.47TTTPPPSPTTSTEE67 pKa = 3.85KK68 pKa = 10.37PSPSTQSSPITTITTTVNPITTTTVAPTTSVAPTTTVAPTPP109 pKa = 3.84
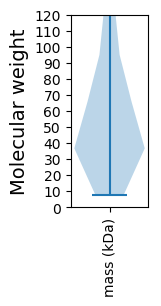
Molecular weight: 11.55 kDa
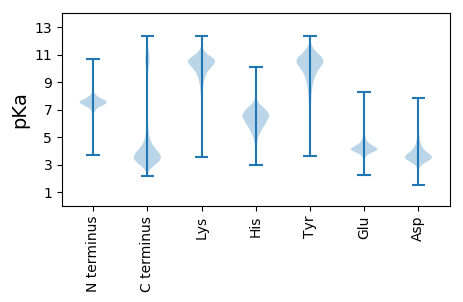
Isoelectric point according different methods:
Protein with the highest isoelectric point:
>tr|A0A6J2XRT1|A0A6J2XRT1_SITOR putative inorganic phosphate cotransporter OS=Sitophilus oryzae OX=7048 GN=LOC115880953 PE=4 SV=1
MM1 pKa = 7.41GRR3 pKa = 11.84ICIRR7 pKa = 11.84KK8 pKa = 8.04ATSTHH13 pKa = 5.08SQAGRR18 pKa = 11.84GNIFLFFLLVCPASNFEE35 pKa = 3.92GRR37 pKa = 11.84KK38 pKa = 9.07CRR40 pKa = 11.84EE41 pKa = 3.85EE42 pKa = 4.16ASITRR47 pKa = 11.84PNLNLLKK54 pKa = 10.49DD55 pKa = 3.94NPGSQRR61 pKa = 11.84DD62 pKa = 3.75FKK64 pKa = 10.1KK65 pKa = 10.81QEE67 pKa = 3.25WRR69 pKa = 11.84SQKK72 pKa = 10.33FYY74 pKa = 10.82IHH76 pKa = 6.92AAYY79 pKa = 9.9DD80 pKa = 3.66QSQKK84 pKa = 11.04NSDD87 pKa = 3.81CSRR90 pKa = 11.84HH91 pKa = 5.21RR92 pKa = 11.84RR93 pKa = 11.84IPGKK97 pKa = 9.96RR98 pKa = 11.84VYY100 pKa = 10.02CQLYY104 pKa = 10.48RR105 pKa = 11.84IDD107 pKa = 4.06RR108 pKa = 11.84NPWSWGHH115 pKa = 5.4SMCPIAVRR123 pKa = 11.84RR124 pKa = 11.84HH125 pKa = 4.92CFFRR129 pKa = 11.84RR130 pKa = 11.84IIIMVGLKK138 pKa = 9.79MNLSKK143 pKa = 10.45MRR145 pKa = 11.84WW146 pKa = 3.22
MM1 pKa = 7.41GRR3 pKa = 11.84ICIRR7 pKa = 11.84KK8 pKa = 8.04ATSTHH13 pKa = 5.08SQAGRR18 pKa = 11.84GNIFLFFLLVCPASNFEE35 pKa = 3.92GRR37 pKa = 11.84KK38 pKa = 9.07CRR40 pKa = 11.84EE41 pKa = 3.85EE42 pKa = 4.16ASITRR47 pKa = 11.84PNLNLLKK54 pKa = 10.49DD55 pKa = 3.94NPGSQRR61 pKa = 11.84DD62 pKa = 3.75FKK64 pKa = 10.1KK65 pKa = 10.81QEE67 pKa = 3.25WRR69 pKa = 11.84SQKK72 pKa = 10.33FYY74 pKa = 10.82IHH76 pKa = 6.92AAYY79 pKa = 9.9DD80 pKa = 3.66QSQKK84 pKa = 11.04NSDD87 pKa = 3.81CSRR90 pKa = 11.84HH91 pKa = 5.21RR92 pKa = 11.84RR93 pKa = 11.84IPGKK97 pKa = 9.96RR98 pKa = 11.84VYY100 pKa = 10.02CQLYY104 pKa = 10.48RR105 pKa = 11.84IDD107 pKa = 4.06RR108 pKa = 11.84NPWSWGHH115 pKa = 5.4SMCPIAVRR123 pKa = 11.84RR124 pKa = 11.84HH125 pKa = 4.92CFFRR129 pKa = 11.84RR130 pKa = 11.84IIIMVGLKK138 pKa = 9.79MNLSKK143 pKa = 10.45MRR145 pKa = 11.84WW146 pKa = 3.22
Molecular weight: 17.35 kDa
Isoelectric point according different methods:
Peptides (in silico digests for buttom-up proteomics)
Below you can find in silico digests of the whole proteome with Trypsin, Chymotrypsin, Trypsin+LysC, LysN, ArgC proteases suitable for different mass spec machines.| Try ESI |
 |
|---|
| ChTry ESI |
 |
|---|
| ArgC ESI |
 |
|---|
| LysN ESI |
 |
|---|
| TryLysC ESI |
 |
|---|
| Try MALDI |
 |
|---|
| ChTry MALDI |
 |
|---|
| ArgC MALDI |
 |
|---|
| LysN MALDI |
 |
|---|
| TryLysC MALDI |
 |
|---|
| Try LTQ |
 |
|---|
| ChTry LTQ |
 |
|---|
| ArgC LTQ |
 |
|---|
| LysN LTQ |
 |
|---|
| TryLysC LTQ |
 |
|---|
| Try MSlow |
 |
|---|
| ChTry MSlow |
 |
|---|
| ArgC MSlow |
 |
|---|
| LysN MSlow |
 |
|---|
| TryLysC MSlow |
 |
|---|
| Try MShigh |
 |
|---|
| ChTry MShigh |
 |
|---|
| ArgC MShigh |
 |
|---|
| LysN MShigh |
 |
|---|
| TryLysC MShigh |
 |
|---|
General Statistics
Number of major isoforms |
Number of additional isoforms |
Number of all proteins |
Number of amino acids |
Min. Seq. Length |
Max. Seq. Length |
Avg. Seq. Length |
Avg. Mol. Weight |
|---|---|---|---|---|---|---|---|
12485201 |
65 |
25382 |
613.5 |
69.29 |
Amino acid frequency
Ala |
Cys |
Asp |
Glu |
Phe |
Gly |
His |
Ile |
Lys |
Leu |
|---|---|---|---|---|---|---|---|---|---|
5.526 ± 0.02 | 1.917 ± 0.02 |
5.544 ± 0.013 | 7.149 ± 0.043 |
3.758 ± 0.015 | 5.229 ± 0.024 |
2.379 ± 0.011 | 5.981 ± 0.017 |
7.365 ± 0.036 | 8.872 ± 0.029 |
Met |
Asn |
Gln |
Pro |
Arg |
Ser |
Thr |
Val |
Trp |
Tyr |
|---|---|---|---|---|---|---|---|---|---|
2.039 ± 0.01 | 5.538 ± 0.021 |
5.185 ± 0.025 | 4.379 ± 0.016 |
4.922 ± 0.017 | 8.277 ± 0.031 |
5.813 ± 0.018 | 5.915 ± 0.019 |
0.979 ± 0.006 | 3.234 ± 0.011 |
Most of the basic statistics you can see at this page can be downloaded from this CSV file
Proteome-pI is available under Creative Commons Attribution-NoDerivs license, for more details see here
| Reference: Kozlowski LP. Proteome-pI 2.0: Proteome Isoelectric Point Database Update. Nucleic Acids Res. 2021, doi: 10.1093/nar/gkab944 | Contact: Lukasz P. Kozlowski |
