Candidatus Thiodictyon syntrophicum
Taxonomy: cellular organisms; Bacteria; Proteobacteria; Gammaproteobacteria; Chromatiales; Chromatiaceae; Thiodictyon
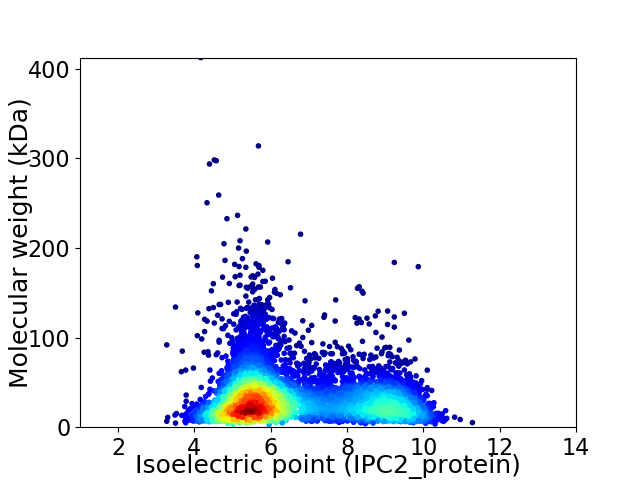
Average proteome isoelectric point is 6.59
Get precalculated fractions of proteins

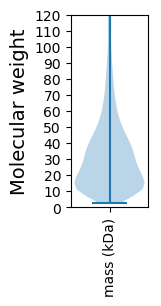
Virtual 2D-PAGE plot for 6068 proteins (isoelectric point calculated using IPC2_protein)
Get csv file with sequences according to given criteria:
* You can choose from 21 different methods for calculating isoelectric point
Summary statistics related to proteome-wise predictions


Protein with the lowest isoelectric point:
>tr|A0A2K8UEG2|A0A2K8UEG2_9GAMM Glyco_trans_4-like_N domain-containing protein OS=Candidatus Thiodictyon syntrophicum OX=1166950 GN=THSYN_24880 PE=4 SV=1
MM1 pKa = 7.14ATLVVDD7 pKa = 4.6RR8 pKa = 11.84GLPVANLTTPNLNISAGVNRR28 pKa = 11.84SNVDD32 pKa = 2.72WSGYY36 pKa = 5.6TAGGQSFITGDD47 pKa = 3.81TFQMPVDD54 pKa = 3.99QQWTIDD60 pKa = 3.97TIRR63 pKa = 11.84TWSPAIPLAGSDD75 pKa = 3.97TLGSLYY81 pKa = 10.97SSITLYY87 pKa = 11.3ADD89 pKa = 4.19LYY91 pKa = 11.1SNLGNDD97 pKa = 3.63PATWAINKK105 pKa = 9.9AGTISGNTSNNDD117 pKa = 2.66ITFTRR122 pKa = 11.84VLYY125 pKa = 10.57QDD127 pKa = 3.1ATAPNDD133 pKa = 3.73DD134 pKa = 3.89YY135 pKa = 11.54QGQSGTWSQIWQVDD149 pKa = 4.04FKK151 pKa = 11.29NLNWVVTPGDD161 pKa = 3.79WIVFGVDD168 pKa = 2.87AAALTTLPWSNHH180 pKa = 4.62ASNAALSNSPQQDD193 pKa = 2.97ADD195 pKa = 4.03DD196 pKa = 4.82FFTFINMTAGFYY208 pKa = 10.92GDD210 pKa = 4.81WYY212 pKa = 10.33DD213 pKa = 4.74CDD215 pKa = 3.84SASDD219 pKa = 4.29PEE221 pKa = 4.73CVWGNSSDD229 pKa = 3.61INVQVFATPAPGSLALALIGLFGLSAARR257 pKa = 11.84RR258 pKa = 11.84TEE260 pKa = 3.76ARR262 pKa = 11.84STAARR267 pKa = 11.84CAPP270 pKa = 3.71
MM1 pKa = 7.14ATLVVDD7 pKa = 4.6RR8 pKa = 11.84GLPVANLTTPNLNISAGVNRR28 pKa = 11.84SNVDD32 pKa = 2.72WSGYY36 pKa = 5.6TAGGQSFITGDD47 pKa = 3.81TFQMPVDD54 pKa = 3.99QQWTIDD60 pKa = 3.97TIRR63 pKa = 11.84TWSPAIPLAGSDD75 pKa = 3.97TLGSLYY81 pKa = 10.97SSITLYY87 pKa = 11.3ADD89 pKa = 4.19LYY91 pKa = 11.1SNLGNDD97 pKa = 3.63PATWAINKK105 pKa = 9.9AGTISGNTSNNDD117 pKa = 2.66ITFTRR122 pKa = 11.84VLYY125 pKa = 10.57QDD127 pKa = 3.1ATAPNDD133 pKa = 3.73DD134 pKa = 3.89YY135 pKa = 11.54QGQSGTWSQIWQVDD149 pKa = 4.04FKK151 pKa = 11.29NLNWVVTPGDD161 pKa = 3.79WIVFGVDD168 pKa = 2.87AAALTTLPWSNHH180 pKa = 4.62ASNAALSNSPQQDD193 pKa = 2.97ADD195 pKa = 4.03DD196 pKa = 4.82FFTFINMTAGFYY208 pKa = 10.92GDD210 pKa = 4.81WYY212 pKa = 10.33DD213 pKa = 4.74CDD215 pKa = 3.84SASDD219 pKa = 4.29PEE221 pKa = 4.73CVWGNSSDD229 pKa = 3.61INVQVFATPAPGSLALALIGLFGLSAARR257 pKa = 11.84RR258 pKa = 11.84TEE260 pKa = 3.76ARR262 pKa = 11.84STAARR267 pKa = 11.84CAPP270 pKa = 3.71
Molecular weight: 28.96 kDa
Isoelectric point according different methods:
Protein with the highest isoelectric point:
>tr|A0A2K8UGB6|A0A2K8UGB6_9GAMM ATP synthase subunit beta OS=Candidatus Thiodictyon syntrophicum OX=1166950 GN=atpD PE=3 SV=1
MM1 pKa = 7.45KK2 pKa = 9.56RR3 pKa = 11.84TFQPSRR9 pKa = 11.84IKK11 pKa = 10.5RR12 pKa = 11.84ARR14 pKa = 11.84THH16 pKa = 5.94GFRR19 pKa = 11.84ARR21 pKa = 11.84SATRR25 pKa = 11.84NGRR28 pKa = 11.84KK29 pKa = 9.31VLSARR34 pKa = 11.84RR35 pKa = 11.84AKK37 pKa = 10.62GRR39 pKa = 11.84VRR41 pKa = 11.84LAPP44 pKa = 3.89
MM1 pKa = 7.45KK2 pKa = 9.56RR3 pKa = 11.84TFQPSRR9 pKa = 11.84IKK11 pKa = 10.5RR12 pKa = 11.84ARR14 pKa = 11.84THH16 pKa = 5.94GFRR19 pKa = 11.84ARR21 pKa = 11.84SATRR25 pKa = 11.84NGRR28 pKa = 11.84KK29 pKa = 9.31VLSARR34 pKa = 11.84RR35 pKa = 11.84AKK37 pKa = 10.62GRR39 pKa = 11.84VRR41 pKa = 11.84LAPP44 pKa = 3.89
Molecular weight: 5.1 kDa
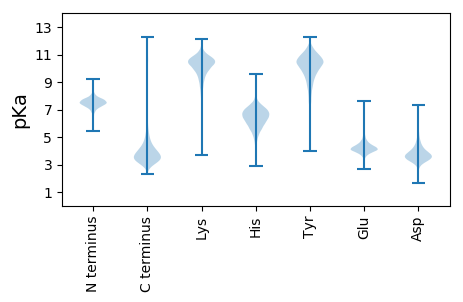
Isoelectric point according different methods:
Peptides (in silico digests for buttom-up proteomics)
Below you can find in silico digests of the whole proteome with Trypsin, Chymotrypsin, Trypsin+LysC, LysN, ArgC proteases suitable for different mass spec machines.| Try ESI |
 |
|---|
| ChTry ESI |
 |
|---|
| ArgC ESI |
 |
|---|
| LysN ESI |
 |
|---|
| TryLysC ESI |
 |
|---|
| Try MALDI |
 |
|---|
| ChTry MALDI |
 |
|---|
| ArgC MALDI |
 |
|---|
| LysN MALDI |
 |
|---|
| TryLysC MALDI |
 |
|---|
| Try LTQ |
 |
|---|
| ChTry LTQ |
 |
|---|
| ArgC LTQ |
 |
|---|
| LysN LTQ |
 |
|---|
| TryLysC LTQ |
 |
|---|
| Try MSlow |
 |
|---|
| ChTry MSlow |
 |
|---|
| ArgC MSlow |
 |
|---|
| LysN MSlow |
 |
|---|
| TryLysC MSlow |
 |
|---|
| Try MShigh |
 |
|---|
| ChTry MShigh |
 |
|---|
| ArgC MShigh |
 |
|---|
| LysN MShigh |
 |
|---|
| TryLysC MShigh |
 |
|---|
General Statistics
Number of major isoforms |
Number of additional isoforms |
Number of all proteins |
Number of amino acids |
Min. Seq. Length |
Max. Seq. Length |
Avg. Seq. Length |
Avg. Mol. Weight |
|---|---|---|---|---|---|---|---|
0 |
2008834 |
27 |
3891 |
331.1 |
36.04 |
Amino acid frequency
Ala |
Cys |
Asp |
Glu |
Phe |
Gly |
His |
Ile |
Lys |
Leu |
|---|---|---|---|---|---|---|---|---|---|
12.777 ± 0.053 | 1.069 ± 0.013 |
5.858 ± 0.025 | 5.429 ± 0.033 |
3.301 ± 0.018 | 8.547 ± 0.038 |
2.11 ± 0.017 | 4.235 ± 0.022 |
2.429 ± 0.023 | 11.581 ± 0.044 |
Met |
Asn |
Gln |
Pro |
Arg |
Ser |
Thr |
Val |
Trp |
Tyr |
|---|---|---|---|---|---|---|---|---|---|
1.818 ± 0.014 | 2.312 ± 0.018 |
5.952 ± 0.028 | 3.744 ± 0.019 |
8.138 ± 0.035 | 4.639 ± 0.022 |
5.234 ± 0.032 | 6.935 ± 0.028 |
1.536 ± 0.015 | 2.358 ± 0.018 |
Most of the basic statistics you can see at this page can be downloaded from this CSV file
Proteome-pI is available under Creative Commons Attribution-NoDerivs license, for more details see here
| Reference: Kozlowski LP. Proteome-pI 2.0: Proteome Isoelectric Point Database Update. Nucleic Acids Res. 2021, doi: 10.1093/nar/gkab944 | Contact: Lukasz P. Kozlowski |
