Pseudarthrobacter phenanthrenivorans (strain DSM 18606 / JCM 16027 / LMG 23796 / Sphe3) (Arthrobacter phenanthrenivorans)
Taxonomy: cellular organisms; Bacteria; Terrabacteria group; Actinobacteria; Actinomycetia; Micrococcales; Micrococcaceae; Pseudarthrobacter; Pseudarthrobacter phenanthrenivorans
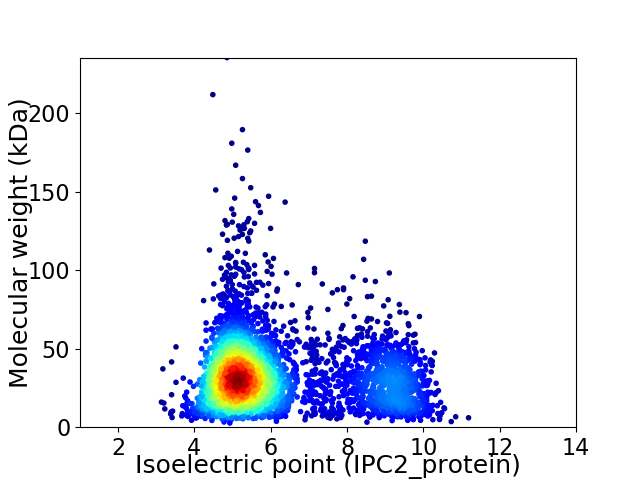
Average proteome isoelectric point is 6.18
Get precalculated fractions of proteins

Virtual 2D-PAGE plot for 4081 proteins (isoelectric point calculated using IPC2_protein)
Get csv file with sequences according to given criteria:
* You can choose from 21 different methods for calculating isoelectric point
Summary statistics related to proteome-wise predictions


Protein with the lowest isoelectric point:
>tr|F0M649|F0M649_PSEPM Probable 2-phosphosulfolactate phosphatase OS=Pseudarthrobacter phenanthrenivorans (strain DSM 18606 / JCM 16027 / LMG 23796 / Sphe3) OX=930171 GN=Asphe3_36040 PE=3 SV=1
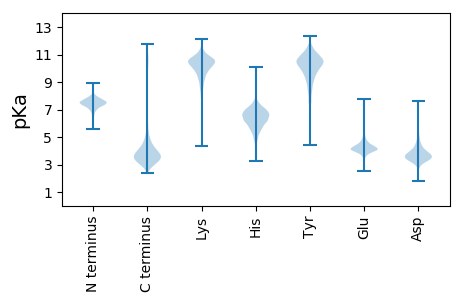
MM1 pKa = 7.26SRR3 pKa = 11.84ALIIVDD9 pKa = 3.67VQNDD13 pKa = 3.63FCEE16 pKa = 4.91GGSLAVSGGADD27 pKa = 3.13VAGAISEE34 pKa = 4.37YY35 pKa = 11.07VEE37 pKa = 3.92AHH39 pKa = 6.25HH40 pKa = 7.22GEE42 pKa = 4.01FDD44 pKa = 5.04HH45 pKa = 7.71IVATQDD51 pKa = 2.81WHH53 pKa = 6.78IDD55 pKa = 3.48PGGHH59 pKa = 6.49FSEE62 pKa = 4.92TPDD65 pKa = 5.2FKK67 pKa = 11.34DD68 pKa = 2.73SWPPHH73 pKa = 5.87CVAGTPGAEE82 pKa = 4.06LHH84 pKa = 7.01PDD86 pKa = 3.48LDD88 pKa = 3.77TEE90 pKa = 4.48YY91 pKa = 10.49IQAYY95 pKa = 6.27FQKK98 pKa = 10.09GQYY101 pKa = 8.56AAAYY105 pKa = 9.73SGFEE109 pKa = 3.96GLLAPEE115 pKa = 4.76DD116 pKa = 3.76AVPTGEE122 pKa = 4.32RR123 pKa = 11.84QPGALPGPGDD133 pKa = 4.01AEE135 pKa = 4.03RR136 pKa = 11.84FAPDD140 pKa = 3.97DD141 pKa = 4.05DD142 pKa = 7.03AIGLDD147 pKa = 4.21DD148 pKa = 4.31WLQSHH153 pKa = 6.64DD154 pKa = 3.82VEE156 pKa = 4.63DD157 pKa = 4.06VVVVGIATDD166 pKa = 3.74YY167 pKa = 11.35CVMATALDD175 pKa = 4.0AVQAGYY181 pKa = 10.65SVTVLRR187 pKa = 11.84SLTAGIAEE195 pKa = 4.43DD196 pKa = 3.95LEE198 pKa = 4.29EE199 pKa = 4.82AVAEE203 pKa = 4.17MEE205 pKa = 4.47LGGVDD210 pKa = 3.52VAA212 pKa = 5.52
MM1 pKa = 7.26SRR3 pKa = 11.84ALIIVDD9 pKa = 3.67VQNDD13 pKa = 3.63FCEE16 pKa = 4.91GGSLAVSGGADD27 pKa = 3.13VAGAISEE34 pKa = 4.37YY35 pKa = 11.07VEE37 pKa = 3.92AHH39 pKa = 6.25HH40 pKa = 7.22GEE42 pKa = 4.01FDD44 pKa = 5.04HH45 pKa = 7.71IVATQDD51 pKa = 2.81WHH53 pKa = 6.78IDD55 pKa = 3.48PGGHH59 pKa = 6.49FSEE62 pKa = 4.92TPDD65 pKa = 5.2FKK67 pKa = 11.34DD68 pKa = 2.73SWPPHH73 pKa = 5.87CVAGTPGAEE82 pKa = 4.06LHH84 pKa = 7.01PDD86 pKa = 3.48LDD88 pKa = 3.77TEE90 pKa = 4.48YY91 pKa = 10.49IQAYY95 pKa = 6.27FQKK98 pKa = 10.09GQYY101 pKa = 8.56AAAYY105 pKa = 9.73SGFEE109 pKa = 3.96GLLAPEE115 pKa = 4.76DD116 pKa = 3.76AVPTGEE122 pKa = 4.32RR123 pKa = 11.84QPGALPGPGDD133 pKa = 4.01AEE135 pKa = 4.03RR136 pKa = 11.84FAPDD140 pKa = 3.97DD141 pKa = 4.05DD142 pKa = 7.03AIGLDD147 pKa = 4.21DD148 pKa = 4.31WLQSHH153 pKa = 6.64DD154 pKa = 3.82VEE156 pKa = 4.63DD157 pKa = 4.06VVVVGIATDD166 pKa = 3.74YY167 pKa = 11.35CVMATALDD175 pKa = 4.0AVQAGYY181 pKa = 10.65SVTVLRR187 pKa = 11.84SLTAGIAEE195 pKa = 4.43DD196 pKa = 3.95LEE198 pKa = 4.29EE199 pKa = 4.82AVAEE203 pKa = 4.17MEE205 pKa = 4.47LGGVDD210 pKa = 3.52VAA212 pKa = 5.52
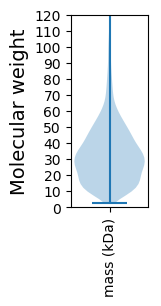
Molecular weight: 22.32 kDa
Isoelectric point according different methods:
Protein with the highest isoelectric point:
>tr|F0M2W7|F0M2W7_PSEPM Uncharacterized protein OS=Pseudarthrobacter phenanthrenivorans (strain DSM 18606 / JCM 16027 / LMG 23796 / Sphe3) OX=930171 GN=Asphe3_09340 PE=4 SV=1
MM1 pKa = 7.41NLGSMIRR8 pKa = 11.84NAAGRR13 pKa = 11.84FSGRR17 pKa = 11.84TGTSGTVRR25 pKa = 11.84GSGLNAPGRR34 pKa = 11.84TPGTTGAPGARR45 pKa = 11.84TGGVAGRR52 pKa = 11.84IMGMLRR58 pKa = 11.84RR59 pKa = 11.84RR60 pKa = 3.58
MM1 pKa = 7.41NLGSMIRR8 pKa = 11.84NAAGRR13 pKa = 11.84FSGRR17 pKa = 11.84TGTSGTVRR25 pKa = 11.84GSGLNAPGRR34 pKa = 11.84TPGTTGAPGARR45 pKa = 11.84TGGVAGRR52 pKa = 11.84IMGMLRR58 pKa = 11.84RR59 pKa = 11.84RR60 pKa = 3.58
Molecular weight: 5.99 kDa
Isoelectric point according different methods:
Peptides (in silico digests for buttom-up proteomics)
Below you can find in silico digests of the whole proteome with Trypsin, Chymotrypsin, Trypsin+LysC, LysN, ArgC proteases suitable for different mass spec machines.| Try ESI |
 |
|---|
| ChTry ESI |
 |
|---|
| ArgC ESI |
 |
|---|
| LysN ESI |
 |
|---|
| TryLysC ESI |
 |
|---|
| Try MALDI |
 |
|---|
| ChTry MALDI |
 |
|---|
| ArgC MALDI |
 |
|---|
| LysN MALDI |
 |
|---|
| TryLysC MALDI |
 |
|---|
| Try LTQ |
 |
|---|
| ChTry LTQ |
 |
|---|
| ArgC LTQ |
 |
|---|
| LysN LTQ |
 |
|---|
| TryLysC LTQ |
 |
|---|
| Try MSlow |
 |
|---|
| ChTry MSlow |
 |
|---|
| ArgC MSlow |
 |
|---|
| LysN MSlow |
 |
|---|
| TryLysC MSlow |
 |
|---|
| Try MShigh |
 |
|---|
| ChTry MShigh |
 |
|---|
| ArgC MShigh |
 |
|---|
| LysN MShigh |
 |
|---|
| TryLysC MShigh |
 |
|---|
General Statistics
Number of major isoforms |
Number of additional isoforms |
Number of all proteins |
Number of amino acids |
Min. Seq. Length |
Max. Seq. Length |
Avg. Seq. Length |
Avg. Mol. Weight |
|---|---|---|---|---|---|---|---|
0 |
1317772 |
26 |
2234 |
322.9 |
34.56 |
Amino acid frequency
Ala |
Cys |
Asp |
Glu |
Phe |
Gly |
His |
Ile |
Lys |
Leu |
|---|---|---|---|---|---|---|---|---|---|
13.147 ± 0.055 | 0.623 ± 0.008 |
5.533 ± 0.034 | 5.727 ± 0.034 |
3.225 ± 0.024 | 9.186 ± 0.033 |
2.084 ± 0.02 | 4.26 ± 0.025 |
2.798 ± 0.026 | 10.255 ± 0.044 |
Met |
Asn |
Gln |
Pro |
Arg |
Ser |
Thr |
Val |
Trp |
Tyr |
|---|---|---|---|---|---|---|---|---|---|
2.007 ± 0.016 | 2.476 ± 0.02 |
5.548 ± 0.03 | 3.213 ± 0.022 |
6.52 ± 0.038 | 5.824 ± 0.027 |
5.724 ± 0.029 | 8.301 ± 0.029 |
1.454 ± 0.016 | 2.095 ± 0.017 |
Most of the basic statistics you can see at this page can be downloaded from this CSV file
Proteome-pI is available under Creative Commons Attribution-NoDerivs license, for more details see here
| Reference: Kozlowski LP. Proteome-pI 2.0: Proteome Isoelectric Point Database Update. Nucleic Acids Res. 2021, doi: 10.1093/nar/gkab944 | Contact: Lukasz P. Kozlowski |
