Halomonas taeanensis
Taxonomy: cellular organisms; Bacteria; Proteobacteria; Gammaproteobacteria; Oceanospirillales; Halomonadaceae; Halomonas
Average proteome isoelectric point is 6.0
Get precalculated fractions of proteins

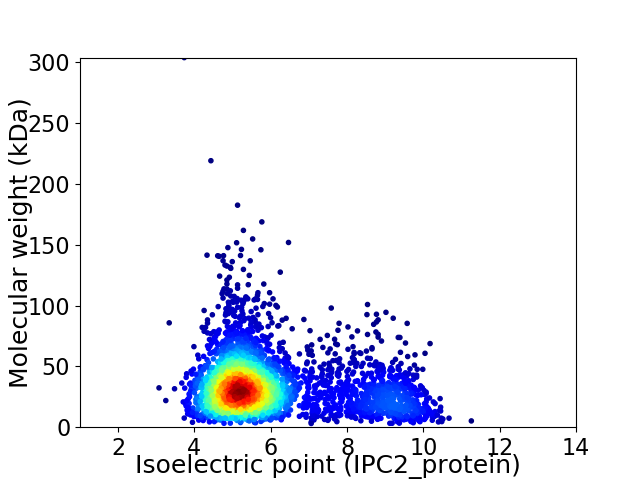
Virtual 2D-PAGE plot for 3429 proteins (isoelectric point calculated using IPC2_protein)
Get csv file with sequences according to given criteria:
* You can choose from 21 different methods for calculating isoelectric point
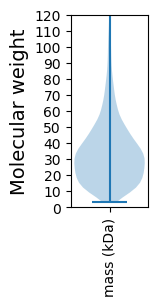
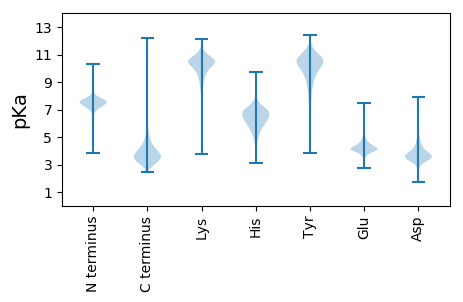
Summary statistics related to proteome-wise predictions


Protein with the lowest isoelectric point:
>tr|A0A1G7N2X4|A0A1G7N2X4_9GAMM Transcription elongation factor GreB OS=Halomonas taeanensis OX=284577 GN=greB PE=3 SV=1
MM1 pKa = 7.71KK2 pKa = 9.06KK3 pKa = 8.27TLLATAIAGAMVVSASASAATVYY26 pKa = 10.79NQDD29 pKa = 3.01GTKK32 pKa = 10.43LDD34 pKa = 3.43IYY36 pKa = 11.42GNIQMVYY43 pKa = 10.28TNINDD48 pKa = 3.92AAGDD52 pKa = 4.09SEE54 pKa = 6.59DD55 pKa = 4.82EE56 pKa = 4.12ITDD59 pKa = 3.32NGTTFGFAAEE69 pKa = 4.18HH70 pKa = 7.0AITSDD75 pKa = 2.92VTGYY79 pKa = 9.51MKK81 pKa = 11.03LEE83 pKa = 4.02FDD85 pKa = 5.9GIQADD90 pKa = 4.0EE91 pKa = 4.36KK92 pKa = 10.33KK93 pKa = 7.5TTGFDD98 pKa = 3.53DD99 pKa = 5.33GGDD102 pKa = 3.49QAYY105 pKa = 10.47VGAKK109 pKa = 10.24GSFGDD114 pKa = 3.92VRR116 pKa = 11.84LGSYY120 pKa = 10.15DD121 pKa = 3.62QLIDD125 pKa = 4.93DD126 pKa = 5.85WIQDD130 pKa = 3.91PITNNEE136 pKa = 3.93YY137 pKa = 10.85FDD139 pKa = 5.56ASDD142 pKa = 3.34STYY145 pKa = 11.57DD146 pKa = 3.21RR147 pKa = 11.84TNDD150 pKa = 3.43NNVGSIRR157 pKa = 11.84EE158 pKa = 4.13TDD160 pKa = 3.12KK161 pKa = 10.77VTYY164 pKa = 9.0TSPSFGGLQFAVGSQYY180 pKa = 11.19KK181 pKa = 10.58GDD183 pKa = 4.13AEE185 pKa = 4.44DD186 pKa = 4.72EE187 pKa = 4.32NVTDD191 pKa = 3.5SGEE194 pKa = 3.8ASFFGGAKK202 pKa = 7.75YY203 pKa = 8.77TVGAFSIAAVYY214 pKa = 10.89DD215 pKa = 3.63NLDD218 pKa = 3.61TFDD221 pKa = 3.67ATTTPEE227 pKa = 3.92TDD229 pKa = 3.57FGDD232 pKa = 3.8QYY234 pKa = 11.86GVTAQYY240 pKa = 9.28TAGALRR246 pKa = 11.84LSAKK250 pKa = 9.44YY251 pKa = 10.46EE252 pKa = 3.96KK253 pKa = 10.58FDD255 pKa = 4.95DD256 pKa = 4.83GSSAEE261 pKa = 3.98NDD263 pKa = 2.87VDD265 pKa = 5.13FAALGARR272 pKa = 11.84YY273 pKa = 9.24GYY275 pKa = 11.56GMGDD279 pKa = 3.04VYY281 pKa = 11.38GAVQEE286 pKa = 4.23VSYY289 pKa = 11.17DD290 pKa = 3.27EE291 pKa = 4.53SGRR294 pKa = 11.84DD295 pKa = 3.38DD296 pKa = 3.59RR297 pKa = 11.84TEE299 pKa = 4.08VIVGGTYY306 pKa = 10.41NISSAMYY313 pKa = 9.16TYY315 pKa = 10.54IEE317 pKa = 4.31VANYY321 pKa = 10.15DD322 pKa = 3.98ADD324 pKa = 3.67EE325 pKa = 4.41DD326 pKa = 4.69AYY328 pKa = 11.16DD329 pKa = 4.15GVATGITYY337 pKa = 9.77LFF339 pKa = 4.37
MM1 pKa = 7.71KK2 pKa = 9.06KK3 pKa = 8.27TLLATAIAGAMVVSASASAATVYY26 pKa = 10.79NQDD29 pKa = 3.01GTKK32 pKa = 10.43LDD34 pKa = 3.43IYY36 pKa = 11.42GNIQMVYY43 pKa = 10.28TNINDD48 pKa = 3.92AAGDD52 pKa = 4.09SEE54 pKa = 6.59DD55 pKa = 4.82EE56 pKa = 4.12ITDD59 pKa = 3.32NGTTFGFAAEE69 pKa = 4.18HH70 pKa = 7.0AITSDD75 pKa = 2.92VTGYY79 pKa = 9.51MKK81 pKa = 11.03LEE83 pKa = 4.02FDD85 pKa = 5.9GIQADD90 pKa = 4.0EE91 pKa = 4.36KK92 pKa = 10.33KK93 pKa = 7.5TTGFDD98 pKa = 3.53DD99 pKa = 5.33GGDD102 pKa = 3.49QAYY105 pKa = 10.47VGAKK109 pKa = 10.24GSFGDD114 pKa = 3.92VRR116 pKa = 11.84LGSYY120 pKa = 10.15DD121 pKa = 3.62QLIDD125 pKa = 4.93DD126 pKa = 5.85WIQDD130 pKa = 3.91PITNNEE136 pKa = 3.93YY137 pKa = 10.85FDD139 pKa = 5.56ASDD142 pKa = 3.34STYY145 pKa = 11.57DD146 pKa = 3.21RR147 pKa = 11.84TNDD150 pKa = 3.43NNVGSIRR157 pKa = 11.84EE158 pKa = 4.13TDD160 pKa = 3.12KK161 pKa = 10.77VTYY164 pKa = 9.0TSPSFGGLQFAVGSQYY180 pKa = 11.19KK181 pKa = 10.58GDD183 pKa = 4.13AEE185 pKa = 4.44DD186 pKa = 4.72EE187 pKa = 4.32NVTDD191 pKa = 3.5SGEE194 pKa = 3.8ASFFGGAKK202 pKa = 7.75YY203 pKa = 8.77TVGAFSIAAVYY214 pKa = 10.89DD215 pKa = 3.63NLDD218 pKa = 3.61TFDD221 pKa = 3.67ATTTPEE227 pKa = 3.92TDD229 pKa = 3.57FGDD232 pKa = 3.8QYY234 pKa = 11.86GVTAQYY240 pKa = 9.28TAGALRR246 pKa = 11.84LSAKK250 pKa = 9.44YY251 pKa = 10.46EE252 pKa = 3.96KK253 pKa = 10.58FDD255 pKa = 4.95DD256 pKa = 4.83GSSAEE261 pKa = 3.98NDD263 pKa = 2.87VDD265 pKa = 5.13FAALGARR272 pKa = 11.84YY273 pKa = 9.24GYY275 pKa = 11.56GMGDD279 pKa = 3.04VYY281 pKa = 11.38GAVQEE286 pKa = 4.23VSYY289 pKa = 11.17DD290 pKa = 3.27EE291 pKa = 4.53SGRR294 pKa = 11.84DD295 pKa = 3.38DD296 pKa = 3.59RR297 pKa = 11.84TEE299 pKa = 4.08VIVGGTYY306 pKa = 10.41NISSAMYY313 pKa = 9.16TYY315 pKa = 10.54IEE317 pKa = 4.31VANYY321 pKa = 10.15DD322 pKa = 3.98ADD324 pKa = 3.67EE325 pKa = 4.41DD326 pKa = 4.69AYY328 pKa = 11.16DD329 pKa = 4.15GVATGITYY337 pKa = 9.77LFF339 pKa = 4.37
Molecular weight: 36.29 kDa
Isoelectric point according different methods:
Protein with the highest isoelectric point:
>tr|A0A1G7S8V3|A0A1G7S8V3_9GAMM Iron complex transport system permease protein OS=Halomonas taeanensis OX=284577 GN=SAMN05216571_10624 PE=3 SV=1
MM1 pKa = 7.45KK2 pKa = 9.51RR3 pKa = 11.84TFQPSVLKK11 pKa = 10.46RR12 pKa = 11.84KK13 pKa = 9.37RR14 pKa = 11.84NHH16 pKa = 5.37GFRR19 pKa = 11.84ARR21 pKa = 11.84MATKK25 pKa = 10.3NGRR28 pKa = 11.84AVLARR33 pKa = 11.84RR34 pKa = 11.84RR35 pKa = 11.84AKK37 pKa = 9.93GRR39 pKa = 11.84KK40 pKa = 8.85RR41 pKa = 11.84LSAA44 pKa = 3.96
MM1 pKa = 7.45KK2 pKa = 9.51RR3 pKa = 11.84TFQPSVLKK11 pKa = 10.46RR12 pKa = 11.84KK13 pKa = 9.37RR14 pKa = 11.84NHH16 pKa = 5.37GFRR19 pKa = 11.84ARR21 pKa = 11.84MATKK25 pKa = 10.3NGRR28 pKa = 11.84AVLARR33 pKa = 11.84RR34 pKa = 11.84RR35 pKa = 11.84AKK37 pKa = 9.93GRR39 pKa = 11.84KK40 pKa = 8.85RR41 pKa = 11.84LSAA44 pKa = 3.96
Molecular weight: 5.16 kDa
Isoelectric point according different methods:
Peptides (in silico digests for buttom-up proteomics)
Below you can find in silico digests of the whole proteome with Trypsin, Chymotrypsin, Trypsin+LysC, LysN, ArgC proteases suitable for different mass spec machines.| Try ESI |
 |
|---|
| ChTry ESI |
 |
|---|
| ArgC ESI |
 |
|---|
| LysN ESI |
 |
|---|
| TryLysC ESI |
 |
|---|
| Try MALDI |
 |
|---|
| ChTry MALDI |
 |
|---|
| ArgC MALDI |
 |
|---|
| LysN MALDI |
 |
|---|
| TryLysC MALDI |
 |
|---|
| Try LTQ |
 |
|---|
| ChTry LTQ |
 |
|---|
| ArgC LTQ |
 |
|---|
| LysN LTQ |
 |
|---|
| TryLysC LTQ |
 |
|---|
| Try MSlow |
 |
|---|
| ChTry MSlow |
 |
|---|
| ArgC MSlow |
 |
|---|
| LysN MSlow |
 |
|---|
| TryLysC MSlow |
 |
|---|
| Try MShigh |
 |
|---|
| ChTry MShigh |
 |
|---|
| ArgC MShigh |
 |
|---|
| LysN MShigh |
 |
|---|
| TryLysC MShigh |
 |
|---|
General Statistics
Number of major isoforms |
Number of additional isoforms |
Number of all proteins |
Number of amino acids |
Min. Seq. Length |
Max. Seq. Length |
Avg. Seq. Length |
Avg. Mol. Weight |
|---|---|---|---|---|---|---|---|
0 |
1106853 |
29 |
2858 |
322.8 |
35.33 |
Amino acid frequency
Ala |
Cys |
Asp |
Glu |
Phe |
Gly |
His |
Ile |
Lys |
Leu |
|---|---|---|---|---|---|---|---|---|---|
11.401 ± 0.055 | 0.928 ± 0.013 |
6.004 ± 0.046 | 6.386 ± 0.041 |
3.378 ± 0.027 | 8.228 ± 0.041 |
2.392 ± 0.025 | 4.647 ± 0.032 |
2.862 ± 0.032 | 11.445 ± 0.056 |
Met |
Asn |
Gln |
Pro |
Arg |
Ser |
Thr |
Val |
Trp |
Tyr |
|---|---|---|---|---|---|---|---|---|---|
2.534 ± 0.022 | 2.565 ± 0.022 |
4.864 ± 0.029 | 3.942 ± 0.028 |
7.003 ± 0.04 | 5.701 ± 0.03 |
4.961 ± 0.026 | 7.008 ± 0.035 |
1.424 ± 0.018 | 2.327 ± 0.018 |
Most of the basic statistics you can see at this page can be downloaded from this CSV file
Proteome-pI is available under Creative Commons Attribution-NoDerivs license, for more details see here
| Reference: Kozlowski LP. Proteome-pI 2.0: Proteome Isoelectric Point Database Update. Nucleic Acids Res. 2021, doi: 10.1093/nar/gkab944 | Contact: Lukasz P. Kozlowski |
