Ursus arctos horribilis
Taxonomy: cellular organisms; Eukaryota; Opisthokonta; Metazoa; Eumetazoa; Bilateria; Deuterostomia; Chordata; Craniata; Vertebrata; Gnathostomata; Teleostomi; Euteleostomi; Sarcopterygii; Dipnotetrapodomorpha; Tetrapoda; Amniota; Mammalia; Theria; Eutheria; Boreoeutheria; Laurasiatheria; Carnivora; Caniformia; Ursi
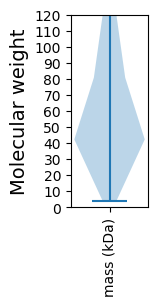
Average proteome isoelectric point is 6.75
Get precalculated fractions of proteins

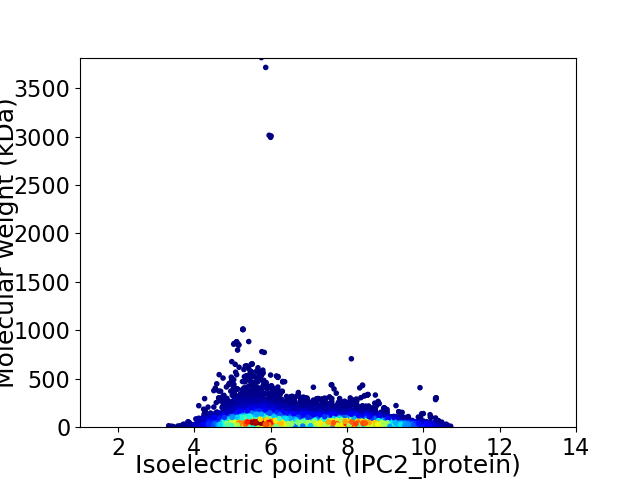
Virtual 2D-PAGE plot for 35419 proteins (isoelectric point calculated using IPC2_protein)
Get csv file with sequences according to given criteria:
* You can choose from 21 different methods for calculating isoelectric point
Summary statistics related to proteome-wise predictions


Protein with the lowest isoelectric point:
>tr|A0A3Q7XC85|A0A3Q7XC85_URSAR vacuolar protein sorting-associated protein 26A isoform X1 OS=Ursus arctos horribilis OX=116960 GN=VPS26A PE=3 SV=1
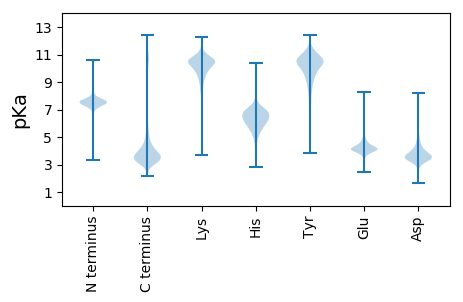
MM1 pKa = 7.32EE2 pKa = 5.25VIVLIPYY9 pKa = 10.0VLGLLLLPLLAVALCVRR26 pKa = 11.84CRR28 pKa = 11.84EE29 pKa = 4.18MPGSYY34 pKa = 8.87DD35 pKa = 3.14TGASDD40 pKa = 4.59SLTPSIMLKK49 pKa = 10.24RR50 pKa = 11.84PPTVVPWPSATSYY63 pKa = 11.6APVTSYY69 pKa = 11.21PPLSQPDD76 pKa = 4.23LLPIPRR82 pKa = 11.84SPQPHH87 pKa = 6.67RR88 pKa = 11.84MPSSRR93 pKa = 11.84QDD95 pKa = 2.92SDD97 pKa = 3.47GANSVASYY105 pKa = 10.42EE106 pKa = 4.16NEE108 pKa = 4.15GTSGAPGALVAGRR121 pKa = 11.84LGPGPGPADD130 pKa = 3.27RR131 pKa = 11.84CVATPEE137 pKa = 4.25PACEE141 pKa = 5.16DD142 pKa = 3.79DD143 pKa = 6.32DD144 pKa = 5.13EE145 pKa = 7.07DD146 pKa = 4.93EE147 pKa = 4.31EE148 pKa = 5.84DD149 pKa = 3.83YY150 pKa = 11.55HH151 pKa = 8.47NEE153 pKa = 4.01GYY155 pKa = 11.01LEE157 pKa = 4.22VLPDD161 pKa = 3.67STPATSTAVAPAPVPSNPGLRR182 pKa = 11.84DD183 pKa = 3.14SAFSMEE189 pKa = 4.23SGEE192 pKa = 4.92DD193 pKa = 3.63YY194 pKa = 11.71VNVAEE199 pKa = 4.65SEE201 pKa = 4.22EE202 pKa = 4.29SADD205 pKa = 3.6VSLDD209 pKa = 3.29GSRR212 pKa = 11.84EE213 pKa = 3.96YY214 pKa = 11.72VNVSQEE220 pKa = 4.44LPPMARR226 pKa = 11.84TEE228 pKa = 3.92AAILNSQKK236 pKa = 10.22VEE238 pKa = 4.2DD239 pKa = 4.43EE240 pKa = 4.21DD241 pKa = 5.59DD242 pKa = 3.99EE243 pKa = 4.77EE244 pKa = 5.11EE245 pKa = 4.32EE246 pKa = 4.72GAPDD250 pKa = 3.77YY251 pKa = 11.52EE252 pKa = 4.36NLQGLHH258 pKa = 6.14
MM1 pKa = 7.32EE2 pKa = 5.25VIVLIPYY9 pKa = 10.0VLGLLLLPLLAVALCVRR26 pKa = 11.84CRR28 pKa = 11.84EE29 pKa = 4.18MPGSYY34 pKa = 8.87DD35 pKa = 3.14TGASDD40 pKa = 4.59SLTPSIMLKK49 pKa = 10.24RR50 pKa = 11.84PPTVVPWPSATSYY63 pKa = 11.6APVTSYY69 pKa = 11.21PPLSQPDD76 pKa = 4.23LLPIPRR82 pKa = 11.84SPQPHH87 pKa = 6.67RR88 pKa = 11.84MPSSRR93 pKa = 11.84QDD95 pKa = 2.92SDD97 pKa = 3.47GANSVASYY105 pKa = 10.42EE106 pKa = 4.16NEE108 pKa = 4.15GTSGAPGALVAGRR121 pKa = 11.84LGPGPGPADD130 pKa = 3.27RR131 pKa = 11.84CVATPEE137 pKa = 4.25PACEE141 pKa = 5.16DD142 pKa = 3.79DD143 pKa = 6.32DD144 pKa = 5.13EE145 pKa = 7.07DD146 pKa = 4.93EE147 pKa = 4.31EE148 pKa = 5.84DD149 pKa = 3.83YY150 pKa = 11.55HH151 pKa = 8.47NEE153 pKa = 4.01GYY155 pKa = 11.01LEE157 pKa = 4.22VLPDD161 pKa = 3.67STPATSTAVAPAPVPSNPGLRR182 pKa = 11.84DD183 pKa = 3.14SAFSMEE189 pKa = 4.23SGEE192 pKa = 4.92DD193 pKa = 3.63YY194 pKa = 11.71VNVAEE199 pKa = 4.65SEE201 pKa = 4.22EE202 pKa = 4.29SADD205 pKa = 3.6VSLDD209 pKa = 3.29GSRR212 pKa = 11.84EE213 pKa = 3.96YY214 pKa = 11.72VNVSQEE220 pKa = 4.44LPPMARR226 pKa = 11.84TEE228 pKa = 3.92AAILNSQKK236 pKa = 10.22VEE238 pKa = 4.2DD239 pKa = 4.43EE240 pKa = 4.21DD241 pKa = 5.59DD242 pKa = 3.99EE243 pKa = 4.77EE244 pKa = 5.11EE245 pKa = 4.32EE246 pKa = 4.72GAPDD250 pKa = 3.77YY251 pKa = 11.52EE252 pKa = 4.36NLQGLHH258 pKa = 6.14
Molecular weight: 27.42 kDa
Isoelectric point according different methods:
Protein with the highest isoelectric point:
>tr|A0A3Q7TGF3|A0A3Q7TGF3_URSAR extended synaptotagmin-2 isoform X1 OS=Ursus arctos horribilis OX=116960 GN=ESYT2 PE=3 SV=1
MM1 pKa = 7.57SSHH4 pKa = 5.15KK5 pKa = 8.91TFRR8 pKa = 11.84IKK10 pKa = 10.64RR11 pKa = 11.84FLAKK15 pKa = 9.71KK16 pKa = 9.58QKK18 pKa = 8.69QNRR21 pKa = 11.84PIPQWIRR28 pKa = 11.84MKK30 pKa = 9.89TGNKK34 pKa = 8.61IRR36 pKa = 11.84YY37 pKa = 7.09NSKK40 pKa = 8.3RR41 pKa = 11.84RR42 pKa = 11.84HH43 pKa = 3.95WRR45 pKa = 11.84RR46 pKa = 11.84TKK48 pKa = 10.83LGLL51 pKa = 3.67
MM1 pKa = 7.57SSHH4 pKa = 5.15KK5 pKa = 8.91TFRR8 pKa = 11.84IKK10 pKa = 10.64RR11 pKa = 11.84FLAKK15 pKa = 9.71KK16 pKa = 9.58QKK18 pKa = 8.69QNRR21 pKa = 11.84PIPQWIRR28 pKa = 11.84MKK30 pKa = 9.89TGNKK34 pKa = 8.61IRR36 pKa = 11.84YY37 pKa = 7.09NSKK40 pKa = 8.3RR41 pKa = 11.84RR42 pKa = 11.84HH43 pKa = 3.95WRR45 pKa = 11.84RR46 pKa = 11.84TKK48 pKa = 10.83LGLL51 pKa = 3.67
Molecular weight: 6.41 kDa
Isoelectric point according different methods:
Peptides (in silico digests for buttom-up proteomics)
Below you can find in silico digests of the whole proteome with Trypsin, Chymotrypsin, Trypsin+LysC, LysN, ArgC proteases suitable for different mass spec machines.| Try ESI |
 |
|---|
| ChTry ESI |
 |
|---|
| ArgC ESI |
 |
|---|
| LysN ESI |
 |
|---|
| TryLysC ESI |
 |
|---|
| Try MALDI |
 |
|---|
| ChTry MALDI |
 |
|---|
| ArgC MALDI |
 |
|---|
| LysN MALDI |
 |
|---|
| TryLysC MALDI |
 |
|---|
| Try LTQ |
 |
|---|
| ChTry LTQ |
 |
|---|
| ArgC LTQ |
 |
|---|
| LysN LTQ |
 |
|---|
| TryLysC LTQ |
 |
|---|
| Try MSlow |
 |
|---|
| ChTry MSlow |
 |
|---|
| ArgC MSlow |
 |
|---|
| LysN MSlow |
 |
|---|
| TryLysC MSlow |
 |
|---|
| Try MShigh |
 |
|---|
| ChTry MShigh |
 |
|---|
| ArgC MShigh |
 |
|---|
| LysN MShigh |
 |
|---|
| TryLysC MShigh |
 |
|---|
General Statistics
Number of major isoforms |
Number of additional isoforms |
Number of all proteins |
Number of amino acids |
Min. Seq. Length |
Max. Seq. Length |
Avg. Seq. Length |
Avg. Mol. Weight |
|---|---|---|---|---|---|---|---|
23023345 |
31 |
34350 |
650.0 |
72.34 |
Amino acid frequency
Ala |
Cys |
Asp |
Glu |
Phe |
Gly |
His |
Ile |
Lys |
Leu |
|---|---|---|---|---|---|---|---|---|---|
7.102 ± 0.014 | 2.143 ± 0.01 |
4.794 ± 0.009 | 7.252 ± 0.018 |
3.51 ± 0.01 | 6.516 ± 0.017 |
2.578 ± 0.006 | 4.207 ± 0.012 |
5.726 ± 0.016 | 9.903 ± 0.017 |
Met |
Asn |
Gln |
Pro |
Arg |
Ser |
Thr |
Val |
Trp |
Tyr |
|---|---|---|---|---|---|---|---|---|---|
2.097 ± 0.006 | 3.515 ± 0.009 |
6.472 ± 0.024 | 4.884 ± 0.015 |
5.817 ± 0.012 | 8.49 ± 0.015 |
5.277 ± 0.012 | 5.995 ± 0.012 |
1.167 ± 0.004 | 2.55 ± 0.007 |
Most of the basic statistics you can see at this page can be downloaded from this CSV file
Proteome-pI is available under Creative Commons Attribution-NoDerivs license, for more details see here
| Reference: Kozlowski LP. Proteome-pI 2.0: Proteome Isoelectric Point Database Update. Nucleic Acids Res. 2021, doi: 10.1093/nar/gkab944 | Contact: Lukasz P. Kozlowski |
