Enterobacter phage phiEap-1
Taxonomy: Viruses; Duplodnaviria; Heunggongvirae; Uroviricota; Caudoviricetes; Caudovirales; Autographiviridae; Studiervirinae; Eapunavirus; Enterobacter virus Eap1
Average proteome isoelectric point is 6.41
Get precalculated fractions of proteins

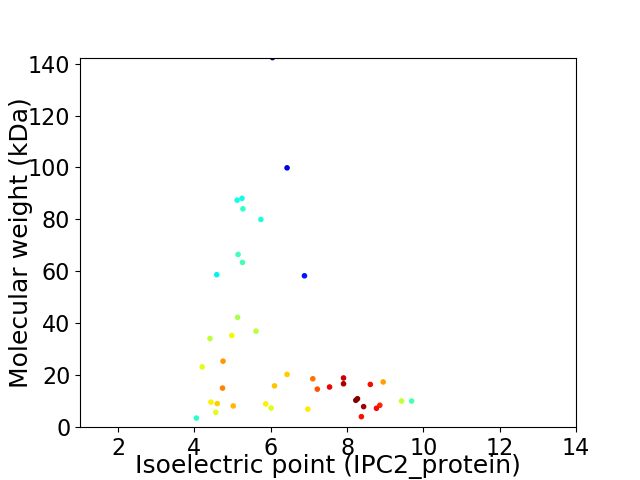
Virtual 2D-PAGE plot for 42 proteins (isoelectric point calculated using IPC2_protein)
Get csv file with sequences according to given criteria:
* You can choose from 21 different methods for calculating isoelectric point
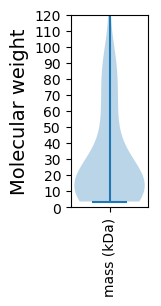
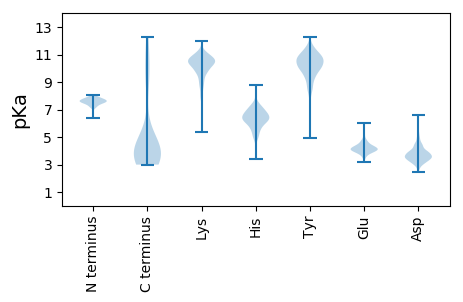
Summary statistics related to proteome-wise predictions


Protein with the lowest isoelectric point:
>tr|A0A0K2FGN0|A0A0K2FGN0_9CAUD Internal virion protein D OS=Enterobacter phage phiEap-1 OX=1587520 GN=RU59_00036 PE=3 SV=1
MM1 pKa = 7.44GPSGLVGFFALGDD14 pKa = 3.77NQMSNLPFTGEE25 pKa = 3.42LDD27 pKa = 4.67AINEE31 pKa = 3.9MLAAIGEE38 pKa = 4.5APVVTLDD45 pKa = 4.53DD46 pKa = 4.21EE47 pKa = 5.09NNVDD51 pKa = 3.3VANARR56 pKa = 11.84RR57 pKa = 11.84ILNKK61 pKa = 9.68INRR64 pKa = 11.84QIQSRR69 pKa = 11.84VWTFNLEE76 pKa = 3.92EE77 pKa = 4.72GATLTPDD84 pKa = 4.57TITKK88 pKa = 9.16LIPYY92 pKa = 9.49SPDD95 pKa = 3.12YY96 pKa = 10.87LSLMNNGGASVYY108 pKa = 9.93VNRR111 pKa = 11.84QGWVYY116 pKa = 10.94DD117 pKa = 3.63KK118 pKa = 11.08SANSDD123 pKa = 3.41QFDD126 pKa = 3.77GPIAVDD132 pKa = 3.28IVRR135 pKa = 11.84LKK137 pKa = 10.69DD138 pKa = 3.54YY139 pKa = 11.62NEE141 pKa = 3.89MPEE144 pKa = 4.66CFRR147 pKa = 11.84SWIVARR153 pKa = 11.84ASRR156 pKa = 11.84QFNSRR161 pKa = 11.84FFGAEE166 pKa = 3.79DD167 pKa = 3.55VAQDD171 pKa = 4.24LAEE174 pKa = 4.42EE175 pKa = 4.22EE176 pKa = 3.53QDD178 pKa = 3.01AAMRR182 pKa = 11.84CFEE185 pKa = 4.26YY186 pKa = 10.86EE187 pKa = 3.86LDD189 pKa = 3.64YY190 pKa = 11.64GKK192 pKa = 11.22YY193 pKa = 10.93NMLDD197 pKa = 2.86GDD199 pKa = 4.31AFVGGLLSRR208 pKa = 4.64
MM1 pKa = 7.44GPSGLVGFFALGDD14 pKa = 3.77NQMSNLPFTGEE25 pKa = 3.42LDD27 pKa = 4.67AINEE31 pKa = 3.9MLAAIGEE38 pKa = 4.5APVVTLDD45 pKa = 4.53DD46 pKa = 4.21EE47 pKa = 5.09NNVDD51 pKa = 3.3VANARR56 pKa = 11.84RR57 pKa = 11.84ILNKK61 pKa = 9.68INRR64 pKa = 11.84QIQSRR69 pKa = 11.84VWTFNLEE76 pKa = 3.92EE77 pKa = 4.72GATLTPDD84 pKa = 4.57TITKK88 pKa = 9.16LIPYY92 pKa = 9.49SPDD95 pKa = 3.12YY96 pKa = 10.87LSLMNNGGASVYY108 pKa = 9.93VNRR111 pKa = 11.84QGWVYY116 pKa = 10.94DD117 pKa = 3.63KK118 pKa = 11.08SANSDD123 pKa = 3.41QFDD126 pKa = 3.77GPIAVDD132 pKa = 3.28IVRR135 pKa = 11.84LKK137 pKa = 10.69DD138 pKa = 3.54YY139 pKa = 11.62NEE141 pKa = 3.89MPEE144 pKa = 4.66CFRR147 pKa = 11.84SWIVARR153 pKa = 11.84ASRR156 pKa = 11.84QFNSRR161 pKa = 11.84FFGAEE166 pKa = 3.79DD167 pKa = 3.55VAQDD171 pKa = 4.24LAEE174 pKa = 4.42EE175 pKa = 4.22EE176 pKa = 3.53QDD178 pKa = 3.01AAMRR182 pKa = 11.84CFEE185 pKa = 4.26YY186 pKa = 10.86EE187 pKa = 3.86LDD189 pKa = 3.64YY190 pKa = 11.64GKK192 pKa = 11.22YY193 pKa = 10.93NMLDD197 pKa = 2.86GDD199 pKa = 4.31AFVGGLLSRR208 pKa = 4.64
Molecular weight: 23.22 kDa
Isoelectric point according different methods:
Protein with the highest isoelectric point:
>tr|A0A0K2FGA0|A0A0K2FGA0_9CAUD Uncharacterized protein OS=Enterobacter phage phiEap-1 OX=1587520 GN=RU59_00012 PE=4 SV=1
MM1 pKa = 7.78RR2 pKa = 11.84LHH4 pKa = 6.24YY5 pKa = 10.28NKK7 pKa = 10.55SNGIFSVRR15 pKa = 11.84RR16 pKa = 11.84ADD18 pKa = 3.58RR19 pKa = 11.84STIAATEE26 pKa = 4.15RR27 pKa = 11.84NGKK30 pKa = 8.65LPRR33 pKa = 11.84MFDD36 pKa = 3.45TFEE39 pKa = 4.37LAPSVHH45 pKa = 6.85IIVTRR50 pKa = 11.84GLYY53 pKa = 9.07EE54 pKa = 3.98AATEE58 pKa = 4.06KK59 pKa = 10.64SRR61 pKa = 11.84PFVPVVVTKK70 pKa = 9.67WPNVRR75 pKa = 11.84GFFMRR80 pKa = 11.84LKK82 pKa = 10.45EE83 pKa = 4.46IINEE87 pKa = 4.07
MM1 pKa = 7.78RR2 pKa = 11.84LHH4 pKa = 6.24YY5 pKa = 10.28NKK7 pKa = 10.55SNGIFSVRR15 pKa = 11.84RR16 pKa = 11.84ADD18 pKa = 3.58RR19 pKa = 11.84STIAATEE26 pKa = 4.15RR27 pKa = 11.84NGKK30 pKa = 8.65LPRR33 pKa = 11.84MFDD36 pKa = 3.45TFEE39 pKa = 4.37LAPSVHH45 pKa = 6.85IIVTRR50 pKa = 11.84GLYY53 pKa = 9.07EE54 pKa = 3.98AATEE58 pKa = 4.06KK59 pKa = 10.64SRR61 pKa = 11.84PFVPVVVTKK70 pKa = 9.67WPNVRR75 pKa = 11.84GFFMRR80 pKa = 11.84LKK82 pKa = 10.45EE83 pKa = 4.46IINEE87 pKa = 4.07
Molecular weight: 10.08 kDa
Isoelectric point according different methods:
Peptides (in silico digests for buttom-up proteomics)
Below you can find in silico digests of the whole proteome with Trypsin, Chymotrypsin, Trypsin+LysC, LysN, ArgC proteases suitable for different mass spec machines.| Try ESI |
 |
|---|
| ChTry ESI |
 |
|---|
| ArgC ESI |
 |
|---|
| LysN ESI |
 |
|---|
| TryLysC ESI |
 |
|---|
| Try MALDI |
 |
|---|
| ChTry MALDI |
 |
|---|
| ArgC MALDI |
 |
|---|
| LysN MALDI |
 |
|---|
| TryLysC MALDI |
 |
|---|
| Try LTQ |
 |
|---|
| ChTry LTQ |
 |
|---|
| ArgC LTQ |
 |
|---|
| LysN LTQ |
 |
|---|
| TryLysC LTQ |
 |
|---|
| Try MSlow |
 |
|---|
| ChTry MSlow |
 |
|---|
| ArgC MSlow |
 |
|---|
| LysN MSlow |
 |
|---|
| TryLysC MSlow |
 |
|---|
| Try MShigh |
 |
|---|
| ChTry MShigh |
 |
|---|
| ArgC MShigh |
 |
|---|
| LysN MShigh |
 |
|---|
| TryLysC MShigh |
 |
|---|
General Statistics
Number of major isoforms |
Number of additional isoforms |
Number of all proteins |
Number of amino acids |
Min. Seq. Length |
Max. Seq. Length |
Avg. Seq. Length |
Avg. Mol. Weight |
|---|---|---|---|---|---|---|---|
0 |
11942 |
33 |
1315 |
284.3 |
31.53 |
Amino acid frequency
Ala |
Cys |
Asp |
Glu |
Phe |
Gly |
His |
Ile |
Lys |
Leu |
|---|---|---|---|---|---|---|---|---|---|
8.834 ± 0.532 | 0.821 ± 0.16 |
6.322 ± 0.206 | 6.833 ± 0.394 |
3.668 ± 0.151 | 8.131 ± 0.41 |
1.75 ± 0.192 | 5.225 ± 0.22 |
6.356 ± 0.317 | 8.131 ± 0.343 |
Met |
Asn |
Gln |
Pro |
Arg |
Ser |
Thr |
Val |
Trp |
Tyr |
|---|---|---|---|---|---|---|---|---|---|
2.671 ± 0.2 | 4.848 ± 0.286 |
3.668 ± 0.214 | 4.045 ± 0.322 |
5.133 ± 0.153 | 6.012 ± 0.297 |
5.837 ± 0.279 | 6.975 ± 0.317 |
1.449 ± 0.189 | 3.291 ± 0.204 |
Most of the basic statistics you can see at this page can be downloaded from this CSV file
Proteome-pI is available under Creative Commons Attribution-NoDerivs license, for more details see here
| Reference: Kozlowski LP. Proteome-pI 2.0: Proteome Isoelectric Point Database Update. Nucleic Acids Res. 2021, doi: 10.1093/nar/gkab944 | Contact: Lukasz P. Kozlowski |
