Mycobacterium phage Fishburne
Taxonomy: Viruses; Duplodnaviria; Heunggongvirae; Uroviricota; Caudoviricetes; Caudovirales; Siphoviridae; Pclasvirinae; Fishburnevirus; Mycobacterium virus Fishburne
Average proteome isoelectric point is 6.17
Get precalculated fractions of proteins

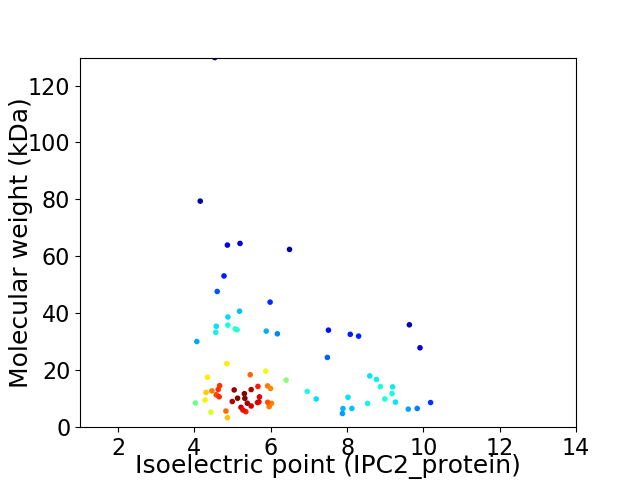
Virtual 2D-PAGE plot for 77 proteins (isoelectric point calculated using IPC2_protein)
Get csv file with sequences according to given criteria:
* You can choose from 21 different methods for calculating isoelectric point
Summary statistics related to proteome-wise predictions


Protein with the lowest isoelectric point:
>tr|R4T9X1|R4T9X1_9CAUD Uncharacterized protein OS=Mycobacterium phage Fishburne OX=1327765 GN=41 PE=4 SV=1
MM1 pKa = 7.78SDD3 pKa = 3.47YY4 pKa = 11.31LDD6 pKa = 4.12ASGLTDD12 pKa = 4.02AGLPDD17 pKa = 4.67EE18 pKa = 5.45YY19 pKa = 11.43LDD21 pKa = 6.24LDD23 pKa = 4.75DD24 pKa = 6.48LDD26 pKa = 5.03LPRR29 pKa = 11.84STAPQCEE36 pKa = 4.53HH37 pKa = 7.06PPVACTAEE45 pKa = 4.19CRR47 pKa = 11.84GVRR50 pKa = 11.84AGSTVARR57 pKa = 11.84FLVTLGTTLVAFALVLALTLGAVLAA82 pKa = 4.94
MM1 pKa = 7.78SDD3 pKa = 3.47YY4 pKa = 11.31LDD6 pKa = 4.12ASGLTDD12 pKa = 4.02AGLPDD17 pKa = 4.67EE18 pKa = 5.45YY19 pKa = 11.43LDD21 pKa = 6.24LDD23 pKa = 4.75DD24 pKa = 6.48LDD26 pKa = 5.03LPRR29 pKa = 11.84STAPQCEE36 pKa = 4.53HH37 pKa = 7.06PPVACTAEE45 pKa = 4.19CRR47 pKa = 11.84GVRR50 pKa = 11.84AGSTVARR57 pKa = 11.84FLVTLGTTLVAFALVLALTLGAVLAA82 pKa = 4.94
Molecular weight: 8.51 kDa
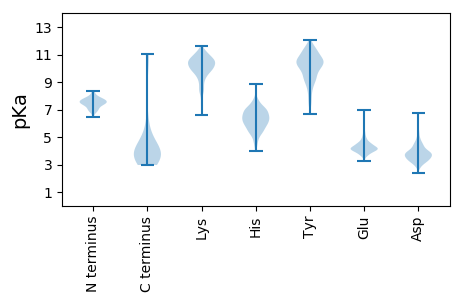
Isoelectric point according different methods:
Protein with the highest isoelectric point:
>tr|R4TQU3|R4TQU3_9CAUD Uncharacterized protein OS=Mycobacterium phage Fishburne OX=1327765 GN=35 PE=4 SV=1
MM1 pKa = 7.69TPRR4 pKa = 11.84QTGSYY9 pKa = 9.41RR10 pKa = 11.84LVSSGRR16 pKa = 11.84EE17 pKa = 3.97GQFPMVNRR25 pKa = 11.84WRR27 pKa = 11.84TWQFAQSLSARR38 pKa = 11.84TVDD41 pKa = 3.31EE42 pKa = 3.98RR43 pKa = 11.84VATVRR48 pKa = 11.84RR49 pKa = 11.84MAVWCGVEE57 pKa = 3.95PEE59 pKa = 4.35FAQVEE64 pKa = 4.91HH65 pKa = 6.35IVSWLAEE72 pKa = 4.26GGQWSARR79 pKa = 11.84TRR81 pKa = 11.84WTYY84 pKa = 11.34YY85 pKa = 10.31GALSAWFLWLQQQGHH100 pKa = 5.14RR101 pKa = 11.84HH102 pKa = 6.2DD103 pKa = 4.56NPMVMIGRR111 pKa = 11.84PKK113 pKa = 10.09RR114 pKa = 11.84PKK116 pKa = 9.75SVPRR120 pKa = 11.84PVSNLDD126 pKa = 3.3MQRR129 pKa = 11.84LLAVRR134 pKa = 11.84AHH136 pKa = 6.47KK137 pKa = 9.25RR138 pKa = 11.84TKK140 pKa = 11.33AMILLAAFQGLRR152 pKa = 11.84VHH154 pKa = 7.38EE155 pKa = 4.11IAQIKK160 pKa = 10.05GEE162 pKa = 4.07HH163 pKa = 6.8LDD165 pKa = 4.12LIEE168 pKa = 4.13RR169 pKa = 11.84TMTVTGKK176 pKa = 11.13GNVTATLPLHH186 pKa = 5.96HH187 pKa = 6.79RR188 pKa = 11.84VVEE191 pKa = 4.15IAYY194 pKa = 8.39QMPRR198 pKa = 11.84KK199 pKa = 9.34GHH201 pKa = 6.4WFPGPDD207 pKa = 2.81RR208 pKa = 11.84GHH210 pKa = 5.51QRR212 pKa = 11.84RR213 pKa = 11.84EE214 pKa = 4.31SVSGTIKK221 pKa = 10.28EE222 pKa = 4.01AMIRR226 pKa = 11.84AGVVGSAHH234 pKa = 7.08CLRR237 pKa = 11.84HH238 pKa = 4.94WFGTALLEE246 pKa = 4.69AGVDD250 pKa = 3.56LRR252 pKa = 11.84TVQEE256 pKa = 4.11LMRR259 pKa = 11.84HH260 pKa = 4.7QSLTSTEE267 pKa = 3.62IYY269 pKa = 10.3TRR271 pKa = 11.84VTDD274 pKa = 3.31QRR276 pKa = 11.84RR277 pKa = 11.84AEE279 pKa = 4.58GIEE282 pKa = 4.09RR283 pKa = 11.84IDD285 pKa = 3.88PFRR288 pKa = 11.84VAPSTRR294 pKa = 11.84VSDD297 pKa = 3.72RR298 pKa = 11.84LLAQIAEE305 pKa = 4.42PVEE308 pKa = 4.59GAAGAAVSAAA318 pKa = 3.56
MM1 pKa = 7.69TPRR4 pKa = 11.84QTGSYY9 pKa = 9.41RR10 pKa = 11.84LVSSGRR16 pKa = 11.84EE17 pKa = 3.97GQFPMVNRR25 pKa = 11.84WRR27 pKa = 11.84TWQFAQSLSARR38 pKa = 11.84TVDD41 pKa = 3.31EE42 pKa = 3.98RR43 pKa = 11.84VATVRR48 pKa = 11.84RR49 pKa = 11.84MAVWCGVEE57 pKa = 3.95PEE59 pKa = 4.35FAQVEE64 pKa = 4.91HH65 pKa = 6.35IVSWLAEE72 pKa = 4.26GGQWSARR79 pKa = 11.84TRR81 pKa = 11.84WTYY84 pKa = 11.34YY85 pKa = 10.31GALSAWFLWLQQQGHH100 pKa = 5.14RR101 pKa = 11.84HH102 pKa = 6.2DD103 pKa = 4.56NPMVMIGRR111 pKa = 11.84PKK113 pKa = 10.09RR114 pKa = 11.84PKK116 pKa = 9.75SVPRR120 pKa = 11.84PVSNLDD126 pKa = 3.3MQRR129 pKa = 11.84LLAVRR134 pKa = 11.84AHH136 pKa = 6.47KK137 pKa = 9.25RR138 pKa = 11.84TKK140 pKa = 11.33AMILLAAFQGLRR152 pKa = 11.84VHH154 pKa = 7.38EE155 pKa = 4.11IAQIKK160 pKa = 10.05GEE162 pKa = 4.07HH163 pKa = 6.8LDD165 pKa = 4.12LIEE168 pKa = 4.13RR169 pKa = 11.84TMTVTGKK176 pKa = 11.13GNVTATLPLHH186 pKa = 5.96HH187 pKa = 6.79RR188 pKa = 11.84VVEE191 pKa = 4.15IAYY194 pKa = 8.39QMPRR198 pKa = 11.84KK199 pKa = 9.34GHH201 pKa = 6.4WFPGPDD207 pKa = 2.81RR208 pKa = 11.84GHH210 pKa = 5.51QRR212 pKa = 11.84RR213 pKa = 11.84EE214 pKa = 4.31SVSGTIKK221 pKa = 10.28EE222 pKa = 4.01AMIRR226 pKa = 11.84AGVVGSAHH234 pKa = 7.08CLRR237 pKa = 11.84HH238 pKa = 4.94WFGTALLEE246 pKa = 4.69AGVDD250 pKa = 3.56LRR252 pKa = 11.84TVQEE256 pKa = 4.11LMRR259 pKa = 11.84HH260 pKa = 4.7QSLTSTEE267 pKa = 3.62IYY269 pKa = 10.3TRR271 pKa = 11.84VTDD274 pKa = 3.31QRR276 pKa = 11.84RR277 pKa = 11.84AEE279 pKa = 4.58GIEE282 pKa = 4.09RR283 pKa = 11.84IDD285 pKa = 3.88PFRR288 pKa = 11.84VAPSTRR294 pKa = 11.84VSDD297 pKa = 3.72RR298 pKa = 11.84LLAQIAEE305 pKa = 4.42PVEE308 pKa = 4.59GAAGAAVSAAA318 pKa = 3.56
Molecular weight: 35.96 kDa
Isoelectric point according different methods:
Peptides (in silico digests for buttom-up proteomics)
Below you can find in silico digests of the whole proteome with Trypsin, Chymotrypsin, Trypsin+LysC, LysN, ArgC proteases suitable for different mass spec machines.| Try ESI |
 |
|---|
| ChTry ESI |
 |
|---|
| ArgC ESI |
 |
|---|
| LysN ESI |
 |
|---|
| TryLysC ESI |
 |
|---|
| Try MALDI |
 |
|---|
| ChTry MALDI |
 |
|---|
| ArgC MALDI |
 |
|---|
| LysN MALDI |
 |
|---|
| TryLysC MALDI |
 |
|---|
| Try LTQ |
 |
|---|
| ChTry LTQ |
 |
|---|
| ArgC LTQ |
 |
|---|
| LysN LTQ |
 |
|---|
| TryLysC LTQ |
 |
|---|
| Try MSlow |
 |
|---|
| ChTry MSlow |
 |
|---|
| ArgC MSlow |
 |
|---|
| LysN MSlow |
 |
|---|
| TryLysC MSlow |
 |
|---|
| Try MShigh |
 |
|---|
| ChTry MShigh |
 |
|---|
| ArgC MShigh |
 |
|---|
| LysN MShigh |
 |
|---|
| TryLysC MShigh |
 |
|---|
General Statistics
Number of major isoforms |
Number of additional isoforms |
Number of all proteins |
Number of amino acids |
Min. Seq. Length |
Max. Seq. Length |
Avg. Seq. Length |
Avg. Mol. Weight |
|---|---|---|---|---|---|---|---|
0 |
15258 |
29 |
1256 |
198.2 |
21.48 |
Amino acid frequency
Ala |
Cys |
Asp |
Glu |
Phe |
Gly |
His |
Ile |
Lys |
Leu |
|---|---|---|---|---|---|---|---|---|---|
12.335 ± 0.557 | 0.937 ± 0.118 |
6.534 ± 0.182 | 6.154 ± 0.344 |
2.871 ± 0.189 | 8.946 ± 0.537 |
1.966 ± 0.161 | 4.273 ± 0.147 |
3.034 ± 0.166 | 7.956 ± 0.281 |
Met |
Asn |
Gln |
Pro |
Arg |
Ser |
Thr |
Val |
Trp |
Tyr |
|---|---|---|---|---|---|---|---|---|---|
1.947 ± 0.106 | 2.969 ± 0.194 |
6.226 ± 0.183 | 3.67 ± 0.286 |
7.413 ± 0.482 | 5.322 ± 0.26 |
6.259 ± 0.244 | 7.085 ± 0.324 |
1.861 ± 0.147 | 2.241 ± 0.121 |
Most of the basic statistics you can see at this page can be downloaded from this CSV file
Proteome-pI is available under Creative Commons Attribution-NoDerivs license, for more details see here
| Reference: Kozlowski LP. Proteome-pI 2.0: Proteome Isoelectric Point Database Update. Nucleic Acids Res. 2021, doi: 10.1093/nar/gkab944 | Contact: Lukasz P. Kozlowski |
