Acidovorax sp. MR-S7
Taxonomy: cellular organisms; Bacteria; Proteobacteria; Betaproteobacteria; Burkholderiales; Comamonadaceae; Acidovorax; unclassified Acidovorax
Average proteome isoelectric point is 7.04
Get precalculated fractions of proteins

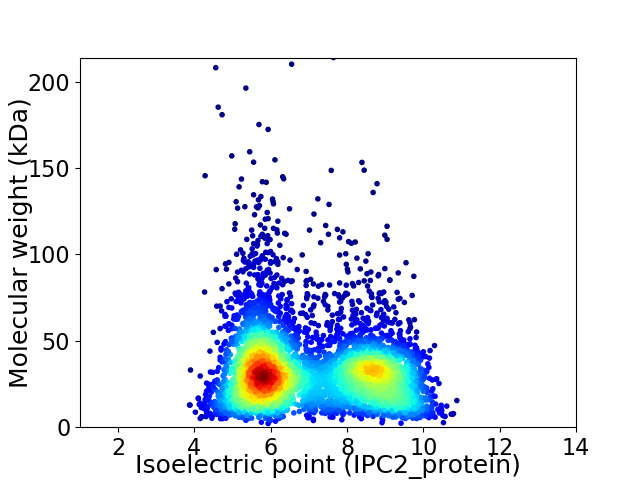
Virtual 2D-PAGE plot for 4762 proteins (isoelectric point calculated using IPC2_protein)
Get csv file with sequences according to given criteria:
* You can choose from 21 different methods for calculating isoelectric point
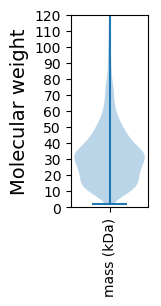
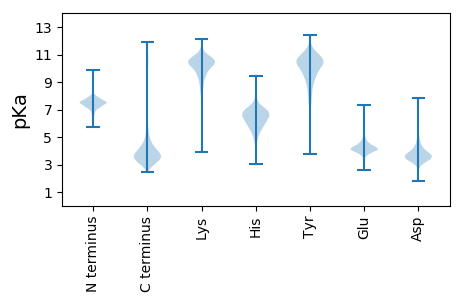
Summary statistics related to proteome-wise predictions


Protein with the lowest isoelectric point:
>tr|A0A081B621|A0A081B621_9BURK Uncharacterized protein OS=Acidovorax sp. MR-S7 OX=1268622 GN=AVS7_00124 PE=4 SV=1
MM1 pKa = 7.26SAVAEE6 pKa = 4.15NTPTDD11 pKa = 3.66MPAPIVFTDD20 pKa = 3.68SAAAKK25 pKa = 10.02VADD28 pKa = 5.45LIAEE32 pKa = 4.31EE33 pKa = 4.82GNPDD37 pKa = 2.99LKK39 pKa = 11.13LRR41 pKa = 11.84VFVQGGGCSGFQYY54 pKa = 10.94GFTFDD59 pKa = 4.81EE60 pKa = 4.64ITNEE64 pKa = 4.77DD65 pKa = 4.2DD66 pKa = 3.25TTMTKK71 pKa = 10.66NGVSLLIDD79 pKa = 3.54AMSYY83 pKa = 10.32QYY85 pKa = 11.5LVGAEE90 pKa = 3.79IDD92 pKa = 3.91YY93 pKa = 11.36KK94 pKa = 11.19EE95 pKa = 4.67DD96 pKa = 3.23LQGAQFVIKK105 pKa = 10.44NPNAQTTCGCGSSFSAA121 pKa = 4.79
MM1 pKa = 7.26SAVAEE6 pKa = 4.15NTPTDD11 pKa = 3.66MPAPIVFTDD20 pKa = 3.68SAAAKK25 pKa = 10.02VADD28 pKa = 5.45LIAEE32 pKa = 4.31EE33 pKa = 4.82GNPDD37 pKa = 2.99LKK39 pKa = 11.13LRR41 pKa = 11.84VFVQGGGCSGFQYY54 pKa = 10.94GFTFDD59 pKa = 4.81EE60 pKa = 4.64ITNEE64 pKa = 4.77DD65 pKa = 4.2DD66 pKa = 3.25TTMTKK71 pKa = 10.66NGVSLLIDD79 pKa = 3.54AMSYY83 pKa = 10.32QYY85 pKa = 11.5LVGAEE90 pKa = 3.79IDD92 pKa = 3.91YY93 pKa = 11.36KK94 pKa = 11.19EE95 pKa = 4.67DD96 pKa = 3.23LQGAQFVIKK105 pKa = 10.44NPNAQTTCGCGSSFSAA121 pKa = 4.79
Molecular weight: 12.85 kDa
Isoelectric point according different methods:
Protein with the highest isoelectric point:
>tr|A0A0A1VMJ3|A0A0A1VMJ3_9BURK Peptide chain release factor 2 OS=Acidovorax sp. MR-S7 OX=1268622 GN=prfB PE=3 SV=1
MM1 pKa = 6.87STRR4 pKa = 11.84RR5 pKa = 11.84PLVHH9 pKa = 7.15LLPGLALCGAVTLVSLGLEE28 pKa = 4.08HH29 pKa = 7.98VEE31 pKa = 3.95AALTGRR37 pKa = 11.84AWLEE41 pKa = 3.68ALVLSIVIGTLLRR54 pKa = 11.84TAWKK58 pKa = 9.16PPASFEE64 pKa = 5.0PGIQCAAKK72 pKa = 8.99TLMEE76 pKa = 4.44AAVMLMGATVSFGAILQAGTPLLAGIVLTVFATIAVSFSLGRR118 pKa = 11.84FFGLPAKK125 pKa = 9.54MAALVACGNSICGNSAIAAVAPAIDD150 pKa = 4.08ADD152 pKa = 4.07SRR154 pKa = 11.84DD155 pKa = 3.7VTTAIAFTAVLGIVVVLLIPVIAHH179 pKa = 5.35VLHH182 pKa = 6.7LNAAASGVLAGLTVYY197 pKa = 10.51AVPQVLAAAAPMGAAAVQVGTLVKK221 pKa = 10.38LIRR224 pKa = 11.84VLMLGPVVATLSILYY239 pKa = 9.83ARR241 pKa = 11.84SRR243 pKa = 11.84RR244 pKa = 11.84SEE246 pKa = 3.86PRR248 pKa = 11.84QAAPRR253 pKa = 11.84RR254 pKa = 11.84SLTQYY259 pKa = 10.39LPVFILVFLALALIRR274 pKa = 11.84SIGLLPQALVAPASSLSGLLTIVAMAGLGLGVDD307 pKa = 4.27LRR309 pKa = 11.84SVTAAGPRR317 pKa = 11.84VSIVVTLSLVVLGGFAMLVLHH338 pKa = 6.72ALKK341 pKa = 10.58LAA343 pKa = 4.09
MM1 pKa = 6.87STRR4 pKa = 11.84RR5 pKa = 11.84PLVHH9 pKa = 7.15LLPGLALCGAVTLVSLGLEE28 pKa = 4.08HH29 pKa = 7.98VEE31 pKa = 3.95AALTGRR37 pKa = 11.84AWLEE41 pKa = 3.68ALVLSIVIGTLLRR54 pKa = 11.84TAWKK58 pKa = 9.16PPASFEE64 pKa = 5.0PGIQCAAKK72 pKa = 8.99TLMEE76 pKa = 4.44AAVMLMGATVSFGAILQAGTPLLAGIVLTVFATIAVSFSLGRR118 pKa = 11.84FFGLPAKK125 pKa = 9.54MAALVACGNSICGNSAIAAVAPAIDD150 pKa = 4.08ADD152 pKa = 4.07SRR154 pKa = 11.84DD155 pKa = 3.7VTTAIAFTAVLGIVVVLLIPVIAHH179 pKa = 5.35VLHH182 pKa = 6.7LNAAASGVLAGLTVYY197 pKa = 10.51AVPQVLAAAAPMGAAAVQVGTLVKK221 pKa = 10.38LIRR224 pKa = 11.84VLMLGPVVATLSILYY239 pKa = 9.83ARR241 pKa = 11.84SRR243 pKa = 11.84RR244 pKa = 11.84SEE246 pKa = 3.86PRR248 pKa = 11.84QAAPRR253 pKa = 11.84RR254 pKa = 11.84SLTQYY259 pKa = 10.39LPVFILVFLALALIRR274 pKa = 11.84SIGLLPQALVAPASSLSGLLTIVAMAGLGLGVDD307 pKa = 4.27LRR309 pKa = 11.84SVTAAGPRR317 pKa = 11.84VSIVVTLSLVVLGGFAMLVLHH338 pKa = 6.72ALKK341 pKa = 10.58LAA343 pKa = 4.09
Molecular weight: 34.9 kDa
Isoelectric point according different methods:
Peptides (in silico digests for buttom-up proteomics)
Below you can find in silico digests of the whole proteome with Trypsin, Chymotrypsin, Trypsin+LysC, LysN, ArgC proteases suitable for different mass spec machines.| Try ESI |
 |
|---|
| ChTry ESI |
 |
|---|
| ArgC ESI |
 |
|---|
| LysN ESI |
 |
|---|
| TryLysC ESI |
 |
|---|
| Try MALDI |
 |
|---|
| ChTry MALDI |
 |
|---|
| ArgC MALDI |
 |
|---|
| LysN MALDI |
 |
|---|
| TryLysC MALDI |
 |
|---|
| Try LTQ |
 |
|---|
| ChTry LTQ |
 |
|---|
| ArgC LTQ |
 |
|---|
| LysN LTQ |
 |
|---|
| TryLysC LTQ |
 |
|---|
| Try MSlow |
 |
|---|
| ChTry MSlow |
 |
|---|
| ArgC MSlow |
 |
|---|
| LysN MSlow |
 |
|---|
| TryLysC MSlow |
 |
|---|
| Try MShigh |
 |
|---|
| ChTry MShigh |
 |
|---|
| ArgC MShigh |
 |
|---|
| LysN MShigh |
 |
|---|
| TryLysC MShigh |
 |
|---|
General Statistics
Number of major isoforms |
Number of additional isoforms |
Number of all proteins |
Number of amino acids |
Min. Seq. Length |
Max. Seq. Length |
Avg. Seq. Length |
Avg. Mol. Weight |
|---|---|---|---|---|---|---|---|
0 |
1533141 |
20 |
1978 |
322.0 |
34.79 |
Amino acid frequency
Ala |
Cys |
Asp |
Glu |
Phe |
Gly |
His |
Ile |
Lys |
Leu |
|---|---|---|---|---|---|---|---|---|---|
13.81 ± 0.057 | 0.978 ± 0.011 |
5.027 ± 0.022 | 5.1 ± 0.034 |
3.276 ± 0.019 | 8.656 ± 0.034 |
2.386 ± 0.023 | 3.934 ± 0.024 |
2.878 ± 0.03 | 10.816 ± 0.044 |
Met |
Asn |
Gln |
Pro |
Arg |
Ser |
Thr |
Val |
Trp |
Tyr |
|---|---|---|---|---|---|---|---|---|---|
2.434 ± 0.016 | 2.319 ± 0.024 |
5.544 ± 0.026 | 4.326 ± 0.026 |
7.2 ± 0.041 | 4.914 ± 0.023 |
5.073 ± 0.034 | 7.608 ± 0.034 |
1.541 ± 0.017 | 2.18 ± 0.016 |
Most of the basic statistics you can see at this page can be downloaded from this CSV file
Proteome-pI is available under Creative Commons Attribution-NoDerivs license, for more details see here
| Reference: Kozlowski LP. Proteome-pI 2.0: Proteome Isoelectric Point Database Update. Nucleic Acids Res. 2021, doi: 10.1093/nar/gkab944 | Contact: Lukasz P. Kozlowski |
