Cellvibrio sp. PSBB023
Taxonomy: cellular organisms; Bacteria; Proteobacteria; Gammaproteobacteria; Cellvibrionales; Cellvibrionaceae; Cellvibrio; unclassified Cellvibrio
Average proteome isoelectric point is 6.26
Get precalculated fractions of proteins
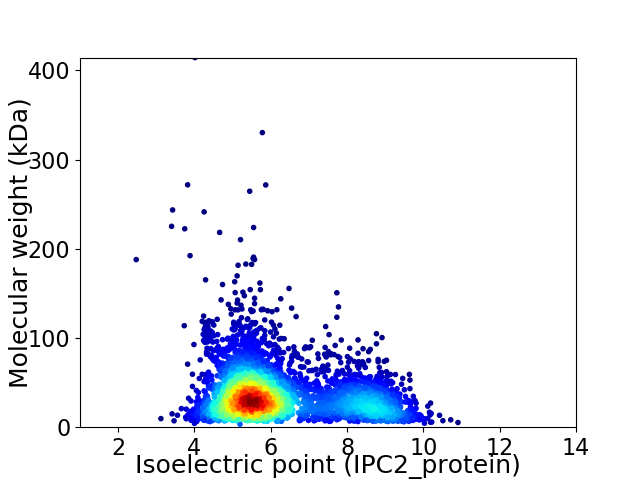
Virtual 2D-PAGE plot for 3892 proteins (isoelectric point calculated using IPC2_protein)
Get csv file with sequences according to given criteria:
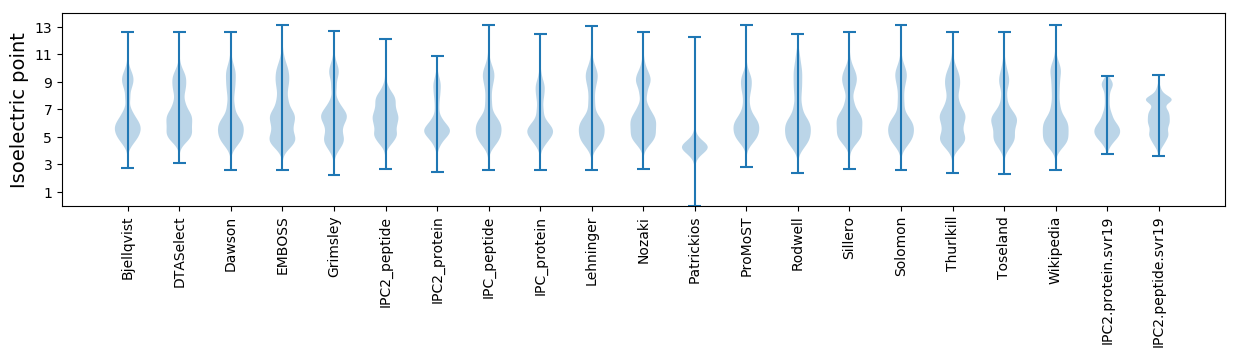
* You can choose from 21 different methods for calculating isoelectric point
Summary statistics related to proteome-wise predictions
Protein with the lowest isoelectric point:
>tr|A0A1U9NDD1|A0A1U9NDD1_9GAMM Uncharacterized protein OS=Cellvibrio sp. PSBB023 OX=1945512 GN=B0D95_16155 PE=4 SV=1
MM1 pKa = 7.95PSPIFVQITPSEE13 pKa = 4.1IGSDD17 pKa = 3.82QILTAQLQVSLQSAAGIVFGLLLNDD42 pKa = 3.36YY43 pKa = 11.17DD44 pKa = 5.32GFPDD48 pKa = 3.93PNAVNAFPKK57 pKa = 10.17YY58 pKa = 10.53NNPTPPEE65 pKa = 4.68DD66 pKa = 4.64PDD68 pKa = 3.74SDD70 pKa = 4.14PYY72 pKa = 10.68KK73 pKa = 10.35CAWDD77 pKa = 3.45IQSVSNLNTASPLLFQAVYY96 pKa = 9.31FPQVGEE102 pKa = 4.43TPDD105 pKa = 3.34QVKK108 pKa = 8.34WFLKK112 pKa = 9.92YY113 pKa = 9.69SVAGIEE119 pKa = 4.28HH120 pKa = 7.14EE121 pKa = 4.3EE122 pKa = 4.34SGWAPLGTT130 pKa = 3.89
MM1 pKa = 7.95PSPIFVQITPSEE13 pKa = 4.1IGSDD17 pKa = 3.82QILTAQLQVSLQSAAGIVFGLLLNDD42 pKa = 3.36YY43 pKa = 11.17DD44 pKa = 5.32GFPDD48 pKa = 3.93PNAVNAFPKK57 pKa = 10.17YY58 pKa = 10.53NNPTPPEE65 pKa = 4.68DD66 pKa = 4.64PDD68 pKa = 3.74SDD70 pKa = 4.14PYY72 pKa = 10.68KK73 pKa = 10.35CAWDD77 pKa = 3.45IQSVSNLNTASPLLFQAVYY96 pKa = 9.31FPQVGEE102 pKa = 4.43TPDD105 pKa = 3.34QVKK108 pKa = 8.34WFLKK112 pKa = 9.92YY113 pKa = 9.69SVAGIEE119 pKa = 4.28HH120 pKa = 7.14EE121 pKa = 4.3EE122 pKa = 4.34SGWAPLGTT130 pKa = 3.89
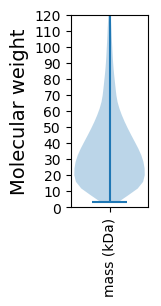
Molecular weight: 14.19 kDa
Isoelectric point according different methods:
Protein with the highest isoelectric point:
>tr|A0A1U9NCR1|A0A1U9NCR1_9GAMM Monovalent cation/H+ antiporter subunit A OS=Cellvibrio sp. PSBB023 OX=1945512 GN=B0D95_15065 PE=4 SV=1
MM1 pKa = 7.45KK2 pKa = 9.61RR3 pKa = 11.84TFQPSNLKK11 pKa = 9.95RR12 pKa = 11.84VRR14 pKa = 11.84NHH16 pKa = 5.46GFRR19 pKa = 11.84ARR21 pKa = 11.84MATKK25 pKa = 10.2SGRR28 pKa = 11.84AVLARR33 pKa = 11.84RR34 pKa = 11.84RR35 pKa = 11.84SKK37 pKa = 10.79GRR39 pKa = 11.84AEE41 pKa = 4.04LTRR44 pKa = 11.84VV45 pKa = 3.16
MM1 pKa = 7.45KK2 pKa = 9.61RR3 pKa = 11.84TFQPSNLKK11 pKa = 9.95RR12 pKa = 11.84VRR14 pKa = 11.84NHH16 pKa = 5.46GFRR19 pKa = 11.84ARR21 pKa = 11.84MATKK25 pKa = 10.2SGRR28 pKa = 11.84AVLARR33 pKa = 11.84RR34 pKa = 11.84RR35 pKa = 11.84SKK37 pKa = 10.79GRR39 pKa = 11.84AEE41 pKa = 4.04LTRR44 pKa = 11.84VV45 pKa = 3.16
Molecular weight: 5.25 kDa
Isoelectric point according different methods:
Peptides (in silico digests for buttom-up proteomics)
Below you can find in silico digests of the whole proteome with Trypsin, Chymotrypsin, Trypsin+LysC, LysN, ArgC proteases suitable for different mass spec machines.| Try ESI |
 |
|---|
| ChTry ESI |
|
|---|
| ArgC ESI |
|
|---|
| LysN ESI |
|
|---|
| TryLysC ESI |
|
|---|
| Try MALDI |
|
|---|
| ChTry MALDI |
|
|---|
| ArgC MALDI |
|
|---|
| LysN MALDI |
|
|---|
| TryLysC MALDI |
|
|---|
| Try LTQ |
|
|---|
| ChTry LTQ |
|
|---|
| ArgC LTQ |
|
|---|
| LysN LTQ |
|
|---|
| TryLysC LTQ |
|
|---|
| Try MSlow |
|
|---|
| ChTry MSlow |
|
|---|
| ArgC MSlow |
|
|---|
| LysN MSlow |
|
|---|
| TryLysC MSlow |
|
|---|
| Try MShigh |
|
|---|
| ChTry MShigh |
|
|---|
| ArgC MShigh |
|
|---|
| LysN MShigh |
|
|---|
| TryLysC MShigh |
|
|---|
General Statistics
Number of major isoforms |
Number of additional isoforms |
Number of all proteins |
Number of amino acids |
Min. Seq. Length |
Max. Seq. Length |
Avg. Seq. Length |
Avg. Mol. Weight |
|---|---|---|---|---|---|---|---|
0 |
1362328 |
30 |
3990 |
350.0 |
38.64 |
Amino acid frequency
Ala |
Cys |
Asp |
Glu |
Phe |
Gly |
His |
Ile |
Lys |
Leu |
|---|---|---|---|---|---|---|---|---|---|
9.901 ± 0.048 | 0.924 ± 0.015 |
5.567 ± 0.045 | 5.644 ± 0.041 |
3.952 ± 0.025 | 7.048 ± 0.045 |
2.189 ± 0.022 | 5.969 ± 0.038 |
4.46 ± 0.037 | 10.502 ± 0.054 |
Met |
Asn |
Gln |
Pro |
Arg |
Ser |
Thr |
Val |
Trp |
Tyr |
|---|---|---|---|---|---|---|---|---|---|
2.275 ± 0.018 | 4.302 ± 0.039 |
4.284 ± 0.028 | 4.547 ± 0.033 |
5.147 ± 0.037 | 6.499 ± 0.044 |
5.559 ± 0.045 | 6.822 ± 0.038 |
1.377 ± 0.016 | 3.029 ± 0.025 |
Most of the basic statistics you can see at this page can be downloaded from this CSV file
See this proteome in:

Proteome-pI is available under Creative Commons Attribution-NoDerivs license, for more details see here
| Reference: Kozlowski LP. Proteome-pI 2.0: Proteome Isoelectric Point Database Update. Nucleic Acids Res. 2021, doi: 10.1093/nar/gkab944 | Contact: Lukasz P. Kozlowski |