Zymoseptoria brevis
Taxonomy: cellular organisms; Eukaryota; Opisthokonta; Fungi; Dikarya; Ascomycota; saccharomyceta; Pezizomycotina; leotiomyceta; dothideomyceta; Dothideomycetes; Dothideomycetidae; Mycosphaerellales; Mycosphaerellaceae; Zymoseptoria
Average proteome isoelectric point is 6.41
Get precalculated fractions of proteins

Virtual 2D-PAGE plot for 10566 proteins (isoelectric point calculated using IPC2_protein)
Get csv file with sequences according to given criteria:
* You can choose from 21 different methods for calculating isoelectric point
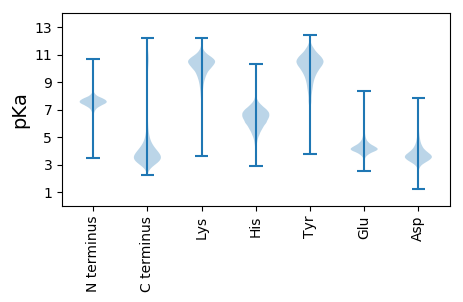
Summary statistics related to proteome-wise predictions


Protein with the lowest isoelectric point:
>tr|A0A0F4GJB6|A0A0F4GJB6_9PEZI Eukaryotic translation initiation factor 3 subunit J OS=Zymoseptoria brevis OX=1047168 GN=HCR1 PE=3 SV=1
MM1 pKa = 7.41GGAISFEE8 pKa = 4.61SNQLAGAINGFRR20 pKa = 11.84STQVFSTSYY29 pKa = 10.98GFDD32 pKa = 3.29PSGSNLFGIIATVSAEE48 pKa = 4.17STSLGVTPIIVFPVTTVEE66 pKa = 4.92AGDD69 pKa = 3.83ASKK72 pKa = 9.51STVTCTPFNDD82 pKa = 4.2GALPTAAAATNQLTCQIANTAIAPGVASVRR112 pKa = 11.84FRR114 pKa = 11.84DD115 pKa = 4.53ANDD118 pKa = 3.23EE119 pKa = 4.44PYY121 pKa = 11.27DD122 pKa = 3.74DD123 pKa = 5.7FYY125 pKa = 11.72VFSIAAPTSLSTSTTIATSITVVDD149 pKa = 4.96GSTVGSTTVTEE160 pKa = 4.52TTFSSTVTEE169 pKa = 4.72TPTSTLTGASSTTYY183 pKa = 10.07VSCSTTTSGTATGTATSSSGSSSTSSGSATTGIDD217 pKa = 3.28SSSGGSSSTSSGSATTGIDD236 pKa = 3.61YY237 pKa = 10.99SSTASNTGIADD248 pKa = 4.08PGTTATASSSTASDD262 pKa = 3.47TATGTTGNDD271 pKa = 3.23SSSNTALAPLYY282 pKa = 7.94PTDD285 pKa = 4.46SNTSSTSCTTAPSSNTTLKK304 pKa = 10.73KK305 pKa = 10.09VIKK308 pKa = 9.14TIIVTDD314 pKa = 4.14CGRR317 pKa = 11.84AAAQTPALHH326 pKa = 6.52PRR328 pKa = 11.84QTTEE332 pKa = 3.67TTILASGFSGPDD344 pKa = 3.23FTFSEE349 pKa = 4.76GNNVGTVTSTSTSVEE364 pKa = 4.19TQSTVVTSGTDD375 pKa = 3.38TVVEE379 pKa = 4.64TSAVTTSTVSTTTVVLDD396 pKa = 3.7EE397 pKa = 4.34RR398 pKa = 11.84TVATVSGCEE407 pKa = 3.65PAAPTFTGG415 pKa = 3.37
MM1 pKa = 7.41GGAISFEE8 pKa = 4.61SNQLAGAINGFRR20 pKa = 11.84STQVFSTSYY29 pKa = 10.98GFDD32 pKa = 3.29PSGSNLFGIIATVSAEE48 pKa = 4.17STSLGVTPIIVFPVTTVEE66 pKa = 4.92AGDD69 pKa = 3.83ASKK72 pKa = 9.51STVTCTPFNDD82 pKa = 4.2GALPTAAAATNQLTCQIANTAIAPGVASVRR112 pKa = 11.84FRR114 pKa = 11.84DD115 pKa = 4.53ANDD118 pKa = 3.23EE119 pKa = 4.44PYY121 pKa = 11.27DD122 pKa = 3.74DD123 pKa = 5.7FYY125 pKa = 11.72VFSIAAPTSLSTSTTIATSITVVDD149 pKa = 4.96GSTVGSTTVTEE160 pKa = 4.52TTFSSTVTEE169 pKa = 4.72TPTSTLTGASSTTYY183 pKa = 10.07VSCSTTTSGTATGTATSSSGSSSTSSGSATTGIDD217 pKa = 3.28SSSGGSSSTSSGSATTGIDD236 pKa = 3.61YY237 pKa = 10.99SSTASNTGIADD248 pKa = 4.08PGTTATASSSTASDD262 pKa = 3.47TATGTTGNDD271 pKa = 3.23SSSNTALAPLYY282 pKa = 7.94PTDD285 pKa = 4.46SNTSSTSCTTAPSSNTTLKK304 pKa = 10.73KK305 pKa = 10.09VIKK308 pKa = 9.14TIIVTDD314 pKa = 4.14CGRR317 pKa = 11.84AAAQTPALHH326 pKa = 6.52PRR328 pKa = 11.84QTTEE332 pKa = 3.67TTILASGFSGPDD344 pKa = 3.23FTFSEE349 pKa = 4.76GNNVGTVTSTSTSVEE364 pKa = 4.19TQSTVVTSGTDD375 pKa = 3.38TVVEE379 pKa = 4.64TSAVTTSTVSTTTVVLDD396 pKa = 3.7EE397 pKa = 4.34RR398 pKa = 11.84TVATVSGCEE407 pKa = 3.65PAAPTFTGG415 pKa = 3.37
Molecular weight: 40.89 kDa
Isoelectric point according different methods:
Protein with the highest isoelectric point:
>tr|A0A0F4GU16|A0A0F4GU16_9PEZI ATP synthase subunit e mitochondrial OS=Zymoseptoria brevis OX=1047168 GN=TI39_contig307g00085 PE=3 SV=1
MM1 pKa = 7.88PSHH4 pKa = 6.91KK5 pKa = 10.39SFRR8 pKa = 11.84TKK10 pKa = 10.45QKK12 pKa = 9.84LAKK15 pKa = 9.55AQKK18 pKa = 8.59QNRR21 pKa = 11.84PIPQWIRR28 pKa = 11.84LRR30 pKa = 11.84TGNTIRR36 pKa = 11.84YY37 pKa = 5.79NAKK40 pKa = 8.89RR41 pKa = 11.84RR42 pKa = 11.84HH43 pKa = 4.15WRR45 pKa = 11.84KK46 pKa = 7.38TRR48 pKa = 11.84IGII51 pKa = 4.0
MM1 pKa = 7.88PSHH4 pKa = 6.91KK5 pKa = 10.39SFRR8 pKa = 11.84TKK10 pKa = 10.45QKK12 pKa = 9.84LAKK15 pKa = 9.55AQKK18 pKa = 8.59QNRR21 pKa = 11.84PIPQWIRR28 pKa = 11.84LRR30 pKa = 11.84TGNTIRR36 pKa = 11.84YY37 pKa = 5.79NAKK40 pKa = 8.89RR41 pKa = 11.84RR42 pKa = 11.84HH43 pKa = 4.15WRR45 pKa = 11.84KK46 pKa = 7.38TRR48 pKa = 11.84IGII51 pKa = 4.0
Molecular weight: 6.25 kDa
Isoelectric point according different methods:
Peptides (in silico digests for buttom-up proteomics)
Below you can find in silico digests of the whole proteome with Trypsin, Chymotrypsin, Trypsin+LysC, LysN, ArgC proteases suitable for different mass spec machines.| Try ESI |
 |
|---|
| ChTry ESI |
 |
|---|
| ArgC ESI |
 |
|---|
| LysN ESI |
 |
|---|
| TryLysC ESI |
 |
|---|
| Try MALDI |
 |
|---|
| ChTry MALDI |
 |
|---|
| ArgC MALDI |
 |
|---|
| LysN MALDI |
 |
|---|
| TryLysC MALDI |
 |
|---|
| Try LTQ |
 |
|---|
| ChTry LTQ |
 |
|---|
| ArgC LTQ |
 |
|---|
| LysN LTQ |
 |
|---|
| TryLysC LTQ |
 |
|---|
| Try MSlow |
 |
|---|
| ChTry MSlow |
 |
|---|
| ArgC MSlow |
 |
|---|
| LysN MSlow |
 |
|---|
| TryLysC MSlow |
 |
|---|
| Try MShigh |
 |
|---|
| ChTry MShigh |
 |
|---|
| ArgC MShigh |
 |
|---|
| LysN MShigh |
 |
|---|
| TryLysC MShigh |
 |
|---|
General Statistics
Number of major isoforms |
Number of additional isoforms |
Number of all proteins |
Number of amino acids |
Min. Seq. Length |
Max. Seq. Length |
Avg. Seq. Length |
Avg. Mol. Weight |
|---|---|---|---|---|---|---|---|
0 |
5141735 |
45 |
7061 |
486.6 |
53.67 |
Amino acid frequency
Ala |
Cys |
Asp |
Glu |
Phe |
Gly |
His |
Ile |
Lys |
Leu |
|---|---|---|---|---|---|---|---|---|---|
9.157 ± 0.023 | 1.156 ± 0.008 |
5.853 ± 0.017 | 6.349 ± 0.023 |
3.526 ± 0.013 | 7.032 ± 0.022 |
2.401 ± 0.011 | 4.52 ± 0.016 |
4.904 ± 0.023 | 8.542 ± 0.025 |
Met |
Asn |
Gln |
Pro |
Arg |
Ser |
Thr |
Val |
Trp |
Tyr |
|---|---|---|---|---|---|---|---|---|---|
2.246 ± 0.009 | 3.599 ± 0.013 |
6.034 ± 0.024 | 4.124 ± 0.019 |
6.192 ± 0.022 | 8.153 ± 0.025 |
6.164 ± 0.021 | 6.038 ± 0.015 |
1.392 ± 0.009 | 2.619 ± 0.012 |
Most of the basic statistics you can see at this page can be downloaded from this CSV file
Proteome-pI is available under Creative Commons Attribution-NoDerivs license, for more details see here
| Reference: Kozlowski LP. Proteome-pI 2.0: Proteome Isoelectric Point Database Update. Nucleic Acids Res. 2021, doi: 10.1093/nar/gkab944 | Contact: Lukasz P. Kozlowski |
