candidate division TM6 bacterium Zodletone_IIa
Taxonomy: cellular organisms; Bacteria; Bacteria incertae sedis; Bacteria candidate phyla; Candidatus Dependentiae; unclassified Candidatus Dependentiae
Average proteome isoelectric point is 7.13
Get precalculated fractions of proteins

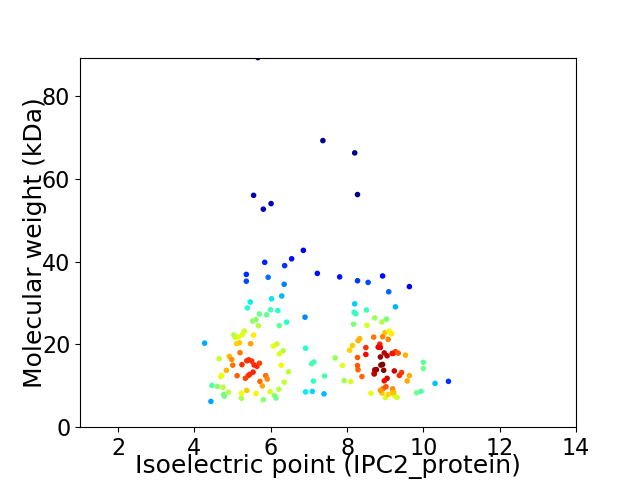
Virtual 2D-PAGE plot for 174 proteins (isoelectric point calculated using IPC2_protein)
Get csv file with sequences according to given criteria:
* You can choose from 21 different methods for calculating isoelectric point
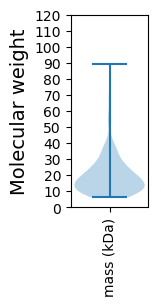
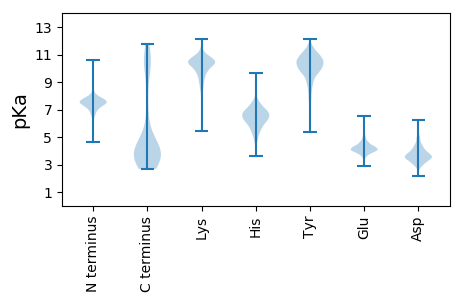
Summary statistics related to proteome-wise predictions


Protein with the lowest isoelectric point:
>tr|A0A0A6Y4E7|A0A0A6Y4E7_9BACT ABC transmembrane type-1 domain-containing protein OS=candidate division TM6 bacterium Zodletone_IIa OX=1511133 GN=AH06_00265 PE=3 SV=1
MM1 pKa = 7.68ANNSNEE7 pKa = 4.63LIDD10 pKa = 5.6DD11 pKa = 3.99NYY13 pKa = 10.63EE14 pKa = 4.02HH15 pKa = 7.54YY16 pKa = 11.0EE17 pKa = 3.88EE18 pKa = 5.82DD19 pKa = 3.41VDD21 pKa = 4.51GKK23 pKa = 10.9KK24 pKa = 9.94IYY26 pKa = 10.37FKK28 pKa = 10.76VAEE31 pKa = 4.21TEE33 pKa = 3.9MTKK36 pKa = 10.15QEE38 pKa = 4.04FSDD41 pKa = 4.68LSEE44 pKa = 5.07DD45 pKa = 3.33DD46 pKa = 4.48CEE48 pKa = 6.37FIFQCLLLADD58 pKa = 5.01DD59 pKa = 5.06LLKK62 pKa = 10.91KK63 pKa = 9.34HH64 pKa = 6.41TDD66 pKa = 3.58GEE68 pKa = 4.75SLNSYY73 pKa = 8.53STVTLDD79 pKa = 5.09NLIDD83 pKa = 5.27LYY85 pKa = 11.68NEE87 pKa = 4.03DD88 pKa = 4.91PKK90 pKa = 11.12IFDD93 pKa = 3.45CTKK96 pKa = 10.11NGFINSIGAAFGHH109 pKa = 6.33FLNKK113 pKa = 10.14NLGTKK118 pKa = 9.47WIVITDD124 pKa = 3.77EE125 pKa = 4.29YY126 pKa = 11.26GDD128 pKa = 4.92DD129 pKa = 4.4FSCQIDD135 pKa = 4.24EE136 pKa = 4.64LNLRR140 pKa = 11.84AFPLNSVAKK149 pKa = 10.37AIEE152 pKa = 4.03QKK154 pKa = 10.59RR155 pKa = 11.84EE156 pKa = 3.7GSLEE160 pKa = 4.11TIYY163 pKa = 11.37LLIKK167 pKa = 9.33RR168 pKa = 11.84QKK170 pKa = 10.88AEE172 pKa = 4.31LEE174 pKa = 4.18AEE176 pKa = 4.27LL177 pKa = 4.98
MM1 pKa = 7.68ANNSNEE7 pKa = 4.63LIDD10 pKa = 5.6DD11 pKa = 3.99NYY13 pKa = 10.63EE14 pKa = 4.02HH15 pKa = 7.54YY16 pKa = 11.0EE17 pKa = 3.88EE18 pKa = 5.82DD19 pKa = 3.41VDD21 pKa = 4.51GKK23 pKa = 10.9KK24 pKa = 9.94IYY26 pKa = 10.37FKK28 pKa = 10.76VAEE31 pKa = 4.21TEE33 pKa = 3.9MTKK36 pKa = 10.15QEE38 pKa = 4.04FSDD41 pKa = 4.68LSEE44 pKa = 5.07DD45 pKa = 3.33DD46 pKa = 4.48CEE48 pKa = 6.37FIFQCLLLADD58 pKa = 5.01DD59 pKa = 5.06LLKK62 pKa = 10.91KK63 pKa = 9.34HH64 pKa = 6.41TDD66 pKa = 3.58GEE68 pKa = 4.75SLNSYY73 pKa = 8.53STVTLDD79 pKa = 5.09NLIDD83 pKa = 5.27LYY85 pKa = 11.68NEE87 pKa = 4.03DD88 pKa = 4.91PKK90 pKa = 11.12IFDD93 pKa = 3.45CTKK96 pKa = 10.11NGFINSIGAAFGHH109 pKa = 6.33FLNKK113 pKa = 10.14NLGTKK118 pKa = 9.47WIVITDD124 pKa = 3.77EE125 pKa = 4.29YY126 pKa = 11.26GDD128 pKa = 4.92DD129 pKa = 4.4FSCQIDD135 pKa = 4.24EE136 pKa = 4.64LNLRR140 pKa = 11.84AFPLNSVAKK149 pKa = 10.37AIEE152 pKa = 4.03QKK154 pKa = 10.59RR155 pKa = 11.84EE156 pKa = 3.7GSLEE160 pKa = 4.11TIYY163 pKa = 11.37LLIKK167 pKa = 9.33RR168 pKa = 11.84QKK170 pKa = 10.88AEE172 pKa = 4.31LEE174 pKa = 4.18AEE176 pKa = 4.27LL177 pKa = 4.98
Molecular weight: 20.3 kDa
Isoelectric point according different methods:
Protein with the highest isoelectric point:
>tr|A0A0A6VHS9|A0A0A6VHS9_9BACT Peptidase_M13 domain-containing protein OS=candidate division TM6 bacterium Zodletone_IIa OX=1511133 GN=AH06_02120 PE=4 SV=1
MM1 pKa = 7.7INRR4 pKa = 11.84LRR6 pKa = 11.84TWLLKK11 pKa = 10.63LPRR14 pKa = 11.84HH15 pKa = 6.18KK16 pKa = 10.44KK17 pKa = 10.1RR18 pKa = 11.84LIQVVADD25 pKa = 3.65VVLVFLALWMTFVVRR40 pKa = 11.84LGIDD44 pKa = 3.36EE45 pKa = 4.93MINPVKK51 pKa = 9.82MHH53 pKa = 6.71LWLFLAAPVVAIPLFIRR70 pKa = 11.84FGMYY74 pKa = 9.45RR75 pKa = 11.84AVMRR79 pKa = 11.84YY80 pKa = 8.76FGNDD84 pKa = 2.92ALVAIIKK91 pKa = 10.0AVSLSSLILGVVVYY105 pKa = 9.22WYY107 pKa = 10.79SNHH110 pKa = 5.49QNVVPPLDD118 pKa = 3.88HH119 pKa = 6.94LQLLVVKK126 pKa = 9.54LDD128 pKa = 3.11HH129 pKa = 6.66GRR131 pKa = 11.84RR132 pKa = 11.84FTLL135 pKa = 3.79
MM1 pKa = 7.7INRR4 pKa = 11.84LRR6 pKa = 11.84TWLLKK11 pKa = 10.63LPRR14 pKa = 11.84HH15 pKa = 6.18KK16 pKa = 10.44KK17 pKa = 10.1RR18 pKa = 11.84LIQVVADD25 pKa = 3.65VVLVFLALWMTFVVRR40 pKa = 11.84LGIDD44 pKa = 3.36EE45 pKa = 4.93MINPVKK51 pKa = 9.82MHH53 pKa = 6.71LWLFLAAPVVAIPLFIRR70 pKa = 11.84FGMYY74 pKa = 9.45RR75 pKa = 11.84AVMRR79 pKa = 11.84YY80 pKa = 8.76FGNDD84 pKa = 2.92ALVAIIKK91 pKa = 10.0AVSLSSLILGVVVYY105 pKa = 9.22WYY107 pKa = 10.79SNHH110 pKa = 5.49QNVVPPLDD118 pKa = 3.88HH119 pKa = 6.94LQLLVVKK126 pKa = 9.54LDD128 pKa = 3.11HH129 pKa = 6.66GRR131 pKa = 11.84RR132 pKa = 11.84FTLL135 pKa = 3.79
Molecular weight: 15.67 kDa
Isoelectric point according different methods:
Peptides (in silico digests for buttom-up proteomics)
Below you can find in silico digests of the whole proteome with Trypsin, Chymotrypsin, Trypsin+LysC, LysN, ArgC proteases suitable for different mass spec machines.| Try ESI |
 |
|---|
| ChTry ESI |
 |
|---|
| ArgC ESI |
 |
|---|
| LysN ESI |
 |
|---|
| TryLysC ESI |
 |
|---|
| Try MALDI |
 |
|---|
| ChTry MALDI |
 |
|---|
| ArgC MALDI |
 |
|---|
| LysN MALDI |
 |
|---|
| TryLysC MALDI |
 |
|---|
| Try LTQ |
 |
|---|
| ChTry LTQ |
 |
|---|
| ArgC LTQ |
 |
|---|
| LysN LTQ |
 |
|---|
| TryLysC LTQ |
 |
|---|
| Try MSlow |
 |
|---|
| ChTry MSlow |
 |
|---|
| ArgC MSlow |
 |
|---|
| LysN MSlow |
 |
|---|
| TryLysC MSlow |
 |
|---|
| Try MShigh |
 |
|---|
| ChTry MShigh |
 |
|---|
| ArgC MShigh |
 |
|---|
| LysN MShigh |
 |
|---|
| TryLysC MShigh |
 |
|---|
General Statistics
Number of major isoforms |
Number of additional isoforms |
Number of all proteins |
Number of amino acids |
Min. Seq. Length |
Max. Seq. Length |
Avg. Seq. Length |
Avg. Mol. Weight |
|---|---|---|---|---|---|---|---|
0 |
30796 |
59 |
802 |
177.0 |
19.9 |
Amino acid frequency
Ala |
Cys |
Asp |
Glu |
Phe |
Gly |
His |
Ile |
Lys |
Leu |
|---|---|---|---|---|---|---|---|---|---|
7.488 ± 0.233 | 1.0 ± 0.081 |
4.793 ± 0.198 | 5.364 ± 0.213 |
5.088 ± 0.197 | 6.475 ± 0.18 |
2.166 ± 0.124 | 7.998 ± 0.231 |
7.131 ± 0.209 | 10.105 ± 0.243 |
Met |
Asn |
Gln |
Pro |
Arg |
Ser |
Thr |
Val |
Trp |
Tyr |
|---|---|---|---|---|---|---|---|---|---|
2.611 ± 0.096 | 5.04 ± 0.152 |
4.147 ± 0.127 | 4.101 ± 0.164 |
3.744 ± 0.139 | 5.913 ± 0.179 |
5.309 ± 0.127 | 6.488 ± 0.168 |
1.237 ± 0.086 | 3.802 ± 0.136 |
Most of the basic statistics you can see at this page can be downloaded from this CSV file
Proteome-pI is available under Creative Commons Attribution-NoDerivs license, for more details see here
| Reference: Kozlowski LP. Proteome-pI 2.0: Proteome Isoelectric Point Database Update. Nucleic Acids Res. 2021, doi: 10.1093/nar/gkab944 | Contact: Lukasz P. Kozlowski |
