Rariglobus hedericola
Taxonomy: cellular organisms; Bacteria; PVC group; Verrucomicrobia; Opitutae; Opitutales; Opitutaceae; Rariglobus
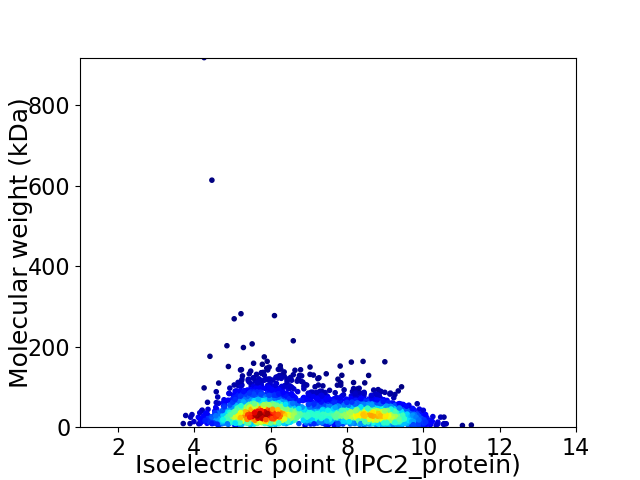
Average proteome isoelectric point is 6.93
Get precalculated fractions of proteins

Virtual 2D-PAGE plot for 3424 proteins (isoelectric point calculated using IPC2_protein)
Get csv file with sequences according to given criteria:
* You can choose from 21 different methods for calculating isoelectric point
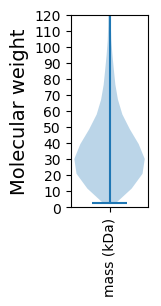
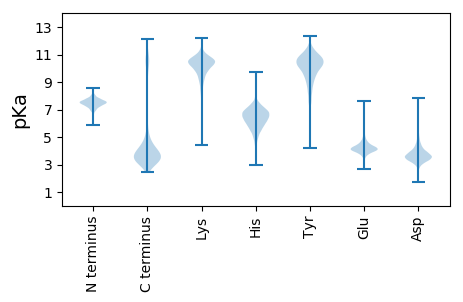
Summary statistics related to proteome-wise predictions


Protein with the lowest isoelectric point:
>tr|A0A556QM92|A0A556QM92_9BACT 30S ribosomal protein S21 OS=Rariglobus hedericola OX=2597822 GN=rpsU PE=3 SV=1
MM1 pKa = 7.18NVIRR5 pKa = 11.84LLFSSVFLAAATSLSALTIDD25 pKa = 4.29FFDD28 pKa = 4.17VNTSTEE34 pKa = 4.05SGPAQSYY41 pKa = 8.11EE42 pKa = 4.08GPGNGVYY49 pKa = 10.71YY50 pKa = 10.44YY51 pKa = 10.94GSDD54 pKa = 3.29SAGGFTSGGAQFVNYY69 pKa = 9.85YY70 pKa = 10.32NSDD73 pKa = 3.13WGSWSGWAYY82 pKa = 9.69STTADD87 pKa = 3.7SVTAGMANQYY97 pKa = 10.69SAFPGALTTGTPYY110 pKa = 11.08GIAYY114 pKa = 9.21VSSYY118 pKa = 11.17DD119 pKa = 3.5GPTTITLPAGIDD131 pKa = 3.59TPLSLTLTNTTYY143 pKa = 10.88AYY145 pKa = 10.86DD146 pKa = 3.43SMLNGDD152 pKa = 4.12SFAKK156 pKa = 10.48KK157 pKa = 10.15FGGVSGNDD165 pKa = 3.21ADD167 pKa = 4.14WFLLTITGKK176 pKa = 10.3DD177 pKa = 3.2AFNATLGSVEE187 pKa = 5.01FYY189 pKa = 11.0LADD192 pKa = 4.15FRR194 pKa = 11.84FADD197 pKa = 3.69NEE199 pKa = 3.87LDD201 pKa = 4.41YY202 pKa = 10.98IITDD206 pKa = 3.32WTDD209 pKa = 2.51VDD211 pKa = 4.21LTGLGTGVHH220 pKa = 5.28TLEE223 pKa = 4.3FTLTSSDD230 pKa = 3.47SGDD233 pKa = 3.43YY234 pKa = 11.44GMNTPSYY241 pKa = 9.05FALGGVTAVPEE252 pKa = 4.21PSAYY256 pKa = 10.02AALVGAFTLVLALTRR271 pKa = 11.84RR272 pKa = 11.84RR273 pKa = 11.84RR274 pKa = 11.84SS275 pKa = 3.13
MM1 pKa = 7.18NVIRR5 pKa = 11.84LLFSSVFLAAATSLSALTIDD25 pKa = 4.29FFDD28 pKa = 4.17VNTSTEE34 pKa = 4.05SGPAQSYY41 pKa = 8.11EE42 pKa = 4.08GPGNGVYY49 pKa = 10.71YY50 pKa = 10.44YY51 pKa = 10.94GSDD54 pKa = 3.29SAGGFTSGGAQFVNYY69 pKa = 9.85YY70 pKa = 10.32NSDD73 pKa = 3.13WGSWSGWAYY82 pKa = 9.69STTADD87 pKa = 3.7SVTAGMANQYY97 pKa = 10.69SAFPGALTTGTPYY110 pKa = 11.08GIAYY114 pKa = 9.21VSSYY118 pKa = 11.17DD119 pKa = 3.5GPTTITLPAGIDD131 pKa = 3.59TPLSLTLTNTTYY143 pKa = 10.88AYY145 pKa = 10.86DD146 pKa = 3.43SMLNGDD152 pKa = 4.12SFAKK156 pKa = 10.48KK157 pKa = 10.15FGGVSGNDD165 pKa = 3.21ADD167 pKa = 4.14WFLLTITGKK176 pKa = 10.3DD177 pKa = 3.2AFNATLGSVEE187 pKa = 5.01FYY189 pKa = 11.0LADD192 pKa = 4.15FRR194 pKa = 11.84FADD197 pKa = 3.69NEE199 pKa = 3.87LDD201 pKa = 4.41YY202 pKa = 10.98IITDD206 pKa = 3.32WTDD209 pKa = 2.51VDD211 pKa = 4.21LTGLGTGVHH220 pKa = 5.28TLEE223 pKa = 4.3FTLTSSDD230 pKa = 3.47SGDD233 pKa = 3.43YY234 pKa = 11.44GMNTPSYY241 pKa = 9.05FALGGVTAVPEE252 pKa = 4.21PSAYY256 pKa = 10.02AALVGAFTLVLALTRR271 pKa = 11.84RR272 pKa = 11.84RR273 pKa = 11.84RR274 pKa = 11.84SS275 pKa = 3.13
Molecular weight: 29.09 kDa
Isoelectric point according different methods:
Protein with the highest isoelectric point:
>tr|A0A556QJA4|A0A556QJA4_9BACT Response regulator OS=Rariglobus hedericola OX=2597822 GN=FPL22_11340 PE=4 SV=1
MM1 pKa = 7.15QPTFRR6 pKa = 11.84PHH8 pKa = 5.7RR9 pKa = 11.84LKK11 pKa = 10.64RR12 pKa = 11.84ARR14 pKa = 11.84KK15 pKa = 8.44IGFFARR21 pKa = 11.84KK22 pKa = 7.88ATVGGRR28 pKa = 11.84KK29 pKa = 9.08VLANRR34 pKa = 11.84RR35 pKa = 11.84RR36 pKa = 11.84KK37 pKa = 8.79GRR39 pKa = 11.84KK40 pKa = 8.81RR41 pKa = 11.84LTVVV45 pKa = 3.08
MM1 pKa = 7.15QPTFRR6 pKa = 11.84PHH8 pKa = 5.7RR9 pKa = 11.84LKK11 pKa = 10.64RR12 pKa = 11.84ARR14 pKa = 11.84KK15 pKa = 8.44IGFFARR21 pKa = 11.84KK22 pKa = 7.88ATVGGRR28 pKa = 11.84KK29 pKa = 9.08VLANRR34 pKa = 11.84RR35 pKa = 11.84RR36 pKa = 11.84KK37 pKa = 8.79GRR39 pKa = 11.84KK40 pKa = 8.81RR41 pKa = 11.84LTVVV45 pKa = 3.08
Molecular weight: 5.32 kDa
Isoelectric point according different methods:
Peptides (in silico digests for buttom-up proteomics)
Below you can find in silico digests of the whole proteome with Trypsin, Chymotrypsin, Trypsin+LysC, LysN, ArgC proteases suitable for different mass spec machines.| Try ESI |
 |
|---|
| ChTry ESI |
 |
|---|
| ArgC ESI |
 |
|---|
| LysN ESI |
 |
|---|
| TryLysC ESI |
 |
|---|
| Try MALDI |
 |
|---|
| ChTry MALDI |
 |
|---|
| ArgC MALDI |
 |
|---|
| LysN MALDI |
 |
|---|
| TryLysC MALDI |
 |
|---|
| Try LTQ |
 |
|---|
| ChTry LTQ |
 |
|---|
| ArgC LTQ |
 |
|---|
| LysN LTQ |
 |
|---|
| TryLysC LTQ |
 |
|---|
| Try MSlow |
 |
|---|
| ChTry MSlow |
 |
|---|
| ArgC MSlow |
 |
|---|
| LysN MSlow |
 |
|---|
| TryLysC MSlow |
 |
|---|
| Try MShigh |
 |
|---|
| ChTry MShigh |
 |
|---|
| ArgC MShigh |
 |
|---|
| LysN MShigh |
 |
|---|
| TryLysC MShigh |
 |
|---|
General Statistics
Number of major isoforms |
Number of additional isoforms |
Number of all proteins |
Number of amino acids |
Min. Seq. Length |
Max. Seq. Length |
Avg. Seq. Length |
Avg. Mol. Weight |
|---|---|---|---|---|---|---|---|
0 |
1258522 |
22 |
9126 |
367.6 |
40.04 |
Amino acid frequency
Ala |
Cys |
Asp |
Glu |
Phe |
Gly |
His |
Ile |
Lys |
Leu |
|---|---|---|---|---|---|---|---|---|---|
11.409 ± 0.053 | 0.857 ± 0.014 |
5.165 ± 0.032 | 5.236 ± 0.049 |
4.044 ± 0.024 | 7.982 ± 0.057 |
2.117 ± 0.028 | 5.156 ± 0.033 |
3.954 ± 0.041 | 10.342 ± 0.046 |
Met |
Asn |
Gln |
Pro |
Arg |
Ser |
Thr |
Val |
Trp |
Tyr |
|---|---|---|---|---|---|---|---|---|---|
1.852 ± 0.021 | 3.268 ± 0.039 |
5.215 ± 0.037 | 3.173 ± 0.022 |
6.335 ± 0.05 | 6.225 ± 0.047 |
6.411 ± 0.079 | 7.248 ± 0.028 |
1.533 ± 0.027 | 2.478 ± 0.021 |
Most of the basic statistics you can see at this page can be downloaded from this CSV file
Proteome-pI is available under Creative Commons Attribution-NoDerivs license, for more details see here
| Reference: Kozlowski LP. Proteome-pI 2.0: Proteome Isoelectric Point Database Update. Nucleic Acids Res. 2021, doi: 10.1093/nar/gkab944 | Contact: Lukasz P. Kozlowski |
