Atopobium minutum 10063974
Taxonomy: cellular organisms; Bacteria; Terrabacteria group; Actinobacteria; Coriobacteriia; Coriobacteriales; Atopobiaceae; Atopobium; Atopobium minutum
Average proteome isoelectric point is 5.94
Get precalculated fractions of proteins

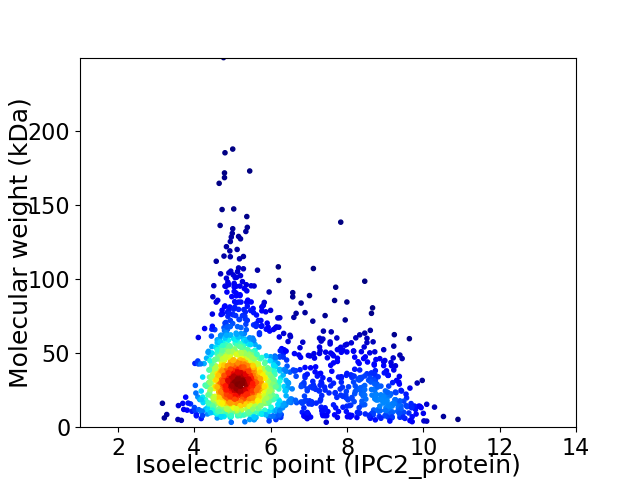
Virtual 2D-PAGE plot for 1539 proteins (isoelectric point calculated using IPC2_protein)
Get csv file with sequences according to given criteria:
* You can choose from 21 different methods for calculating isoelectric point
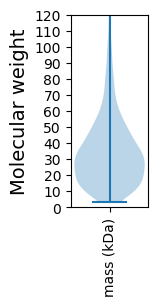
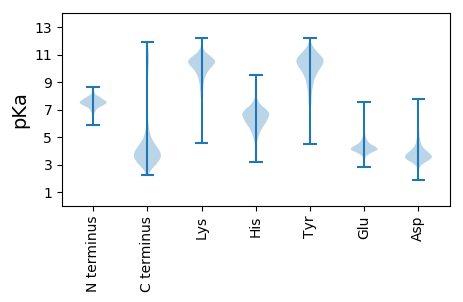
Summary statistics related to proteome-wise predictions


Protein with the lowest isoelectric point:
>tr|N2BTA6|N2BTA6_9ACTN Cell division protein FtsL OS=Atopobium minutum 10063974 OX=997872 GN=HMPREF1091_00709 PE=4 SV=1
MM1 pKa = 7.14SQLEE5 pKa = 4.14ALVVKK10 pKa = 10.81VDD12 pKa = 4.54DD13 pKa = 4.21RR14 pKa = 11.84LANLGDD20 pKa = 3.72TLSLDD25 pKa = 3.3GHH27 pKa = 6.94IDD29 pKa = 3.49QEE31 pKa = 4.71SFSLGDD37 pKa = 3.47HH38 pKa = 6.01TFMLPEE44 pKa = 5.14GISYY48 pKa = 11.04NLVLTNAGEE57 pKa = 4.76GILVTGIVKK66 pKa = 10.09AQAEE70 pKa = 4.83GVCDD74 pKa = 3.58RR75 pKa = 11.84CLDD78 pKa = 4.07PAHH81 pKa = 7.23LDD83 pKa = 3.48LSAEE87 pKa = 3.82VDD89 pKa = 3.51EE90 pKa = 4.91YY91 pKa = 11.65FLFEE95 pKa = 4.06EE96 pKa = 4.58PQAISEE102 pKa = 4.23EE103 pKa = 4.21QSDD106 pKa = 4.03EE107 pKa = 4.28EE108 pKa = 4.35EE109 pKa = 4.51GVDD112 pKa = 4.42FSLVSDD118 pKa = 4.21EE119 pKa = 4.35DD120 pKa = 4.34TIDD123 pKa = 3.34VSEE126 pKa = 4.71ALLSALLMEE135 pKa = 4.77TPYY138 pKa = 10.56IVLCRR143 pKa = 11.84EE144 pKa = 4.18DD145 pKa = 4.99CKK147 pKa = 11.17GLCPNCGANLNEE159 pKa = 4.07QDD161 pKa = 4.41CGCVAKK167 pKa = 10.71KK168 pKa = 10.4EE169 pKa = 4.01EE170 pKa = 4.04QAALEE175 pKa = 4.6GPFAALGKK183 pKa = 10.34LDD185 pKa = 5.41LNDD188 pKa = 3.39
MM1 pKa = 7.14SQLEE5 pKa = 4.14ALVVKK10 pKa = 10.81VDD12 pKa = 4.54DD13 pKa = 4.21RR14 pKa = 11.84LANLGDD20 pKa = 3.72TLSLDD25 pKa = 3.3GHH27 pKa = 6.94IDD29 pKa = 3.49QEE31 pKa = 4.71SFSLGDD37 pKa = 3.47HH38 pKa = 6.01TFMLPEE44 pKa = 5.14GISYY48 pKa = 11.04NLVLTNAGEE57 pKa = 4.76GILVTGIVKK66 pKa = 10.09AQAEE70 pKa = 4.83GVCDD74 pKa = 3.58RR75 pKa = 11.84CLDD78 pKa = 4.07PAHH81 pKa = 7.23LDD83 pKa = 3.48LSAEE87 pKa = 3.82VDD89 pKa = 3.51EE90 pKa = 4.91YY91 pKa = 11.65FLFEE95 pKa = 4.06EE96 pKa = 4.58PQAISEE102 pKa = 4.23EE103 pKa = 4.21QSDD106 pKa = 4.03EE107 pKa = 4.28EE108 pKa = 4.35EE109 pKa = 4.51GVDD112 pKa = 4.42FSLVSDD118 pKa = 4.21EE119 pKa = 4.35DD120 pKa = 4.34TIDD123 pKa = 3.34VSEE126 pKa = 4.71ALLSALLMEE135 pKa = 4.77TPYY138 pKa = 10.56IVLCRR143 pKa = 11.84EE144 pKa = 4.18DD145 pKa = 4.99CKK147 pKa = 11.17GLCPNCGANLNEE159 pKa = 4.07QDD161 pKa = 4.41CGCVAKK167 pKa = 10.71KK168 pKa = 10.4EE169 pKa = 4.01EE170 pKa = 4.04QAALEE175 pKa = 4.6GPFAALGKK183 pKa = 10.34LDD185 pKa = 5.41LNDD188 pKa = 3.39
Molecular weight: 20.29 kDa
Isoelectric point according different methods:
Protein with the highest isoelectric point:
>tr|N2C0J7|N2C0J7_9ACTN Uncharacterized protein OS=Atopobium minutum 10063974 OX=997872 GN=HMPREF1091_00257 PE=4 SV=1
MM1 pKa = 7.35KK2 pKa = 9.42RR3 pKa = 11.84TYY5 pKa = 10.3QPNKK9 pKa = 8.42RR10 pKa = 11.84RR11 pKa = 11.84RR12 pKa = 11.84AKK14 pKa = 8.97THH16 pKa = 5.3GFRR19 pKa = 11.84ARR21 pKa = 11.84MATKK25 pKa = 10.24AGRR28 pKa = 11.84DD29 pKa = 3.41VLSRR33 pKa = 11.84RR34 pKa = 11.84RR35 pKa = 11.84AKK37 pKa = 9.83GRR39 pKa = 11.84KK40 pKa = 8.88RR41 pKa = 11.84LTVV44 pKa = 3.11
MM1 pKa = 7.35KK2 pKa = 9.42RR3 pKa = 11.84TYY5 pKa = 10.3QPNKK9 pKa = 8.42RR10 pKa = 11.84RR11 pKa = 11.84RR12 pKa = 11.84AKK14 pKa = 8.97THH16 pKa = 5.3GFRR19 pKa = 11.84ARR21 pKa = 11.84MATKK25 pKa = 10.24AGRR28 pKa = 11.84DD29 pKa = 3.41VLSRR33 pKa = 11.84RR34 pKa = 11.84RR35 pKa = 11.84AKK37 pKa = 9.83GRR39 pKa = 11.84KK40 pKa = 8.88RR41 pKa = 11.84LTVV44 pKa = 3.11
Molecular weight: 5.27 kDa
Isoelectric point according different methods:
Peptides (in silico digests for buttom-up proteomics)
Below you can find in silico digests of the whole proteome with Trypsin, Chymotrypsin, Trypsin+LysC, LysN, ArgC proteases suitable for different mass spec machines.| Try ESI |
 |
|---|
| ChTry ESI |
 |
|---|
| ArgC ESI |
 |
|---|
| LysN ESI |
 |
|---|
| TryLysC ESI |
 |
|---|
| Try MALDI |
 |
|---|
| ChTry MALDI |
 |
|---|
| ArgC MALDI |
 |
|---|
| LysN MALDI |
 |
|---|
| TryLysC MALDI |
 |
|---|
| Try LTQ |
 |
|---|
| ChTry LTQ |
 |
|---|
| ArgC LTQ |
 |
|---|
| LysN LTQ |
 |
|---|
| TryLysC LTQ |
 |
|---|
| Try MSlow |
 |
|---|
| ChTry MSlow |
 |
|---|
| ArgC MSlow |
 |
|---|
| LysN MSlow |
 |
|---|
| TryLysC MSlow |
 |
|---|
| Try MShigh |
 |
|---|
| ChTry MShigh |
 |
|---|
| ArgC MShigh |
 |
|---|
| LysN MShigh |
 |
|---|
| TryLysC MShigh |
 |
|---|
General Statistics
Number of major isoforms |
Number of additional isoforms |
Number of all proteins |
Number of amino acids |
Min. Seq. Length |
Max. Seq. Length |
Avg. Seq. Length |
Avg. Mol. Weight |
|---|---|---|---|---|---|---|---|
0 |
511244 |
32 |
2291 |
332.2 |
36.4 |
Amino acid frequency
Ala |
Cys |
Asp |
Glu |
Phe |
Gly |
His |
Ile |
Lys |
Leu |
|---|---|---|---|---|---|---|---|---|---|
10.335 ± 0.069 | 1.425 ± 0.027 |
5.989 ± 0.051 | 5.938 ± 0.061 |
3.672 ± 0.04 | 7.147 ± 0.049 |
2.167 ± 0.029 | 5.88 ± 0.058 |
4.826 ± 0.055 | 9.481 ± 0.067 |
Met |
Asn |
Gln |
Pro |
Arg |
Ser |
Thr |
Val |
Trp |
Tyr |
|---|---|---|---|---|---|---|---|---|---|
2.577 ± 0.029 | 3.505 ± 0.04 |
3.975 ± 0.039 | 3.998 ± 0.043 |
4.821 ± 0.056 | 6.615 ± 0.053 |
6.053 ± 0.052 | 7.513 ± 0.048 |
1.034 ± 0.026 | 3.049 ± 0.039 |
Most of the basic statistics you can see at this page can be downloaded from this CSV file
Proteome-pI is available under Creative Commons Attribution-NoDerivs license, for more details see here
| Reference: Kozlowski LP. Proteome-pI 2.0: Proteome Isoelectric Point Database Update. Nucleic Acids Res. 2021, doi: 10.1093/nar/gkab944 | Contact: Lukasz P. Kozlowski |
