Brumimicrobium salinarum
Taxonomy: cellular organisms; Bacteria; FCB group; Bacteroidetes/Chlorobi group; Bacteroidetes; Flavobacteriia; Flavobacteriales; Crocinitomicaceae; Brumimicrobium
Average proteome isoelectric point is 6.51
Get precalculated fractions of proteins

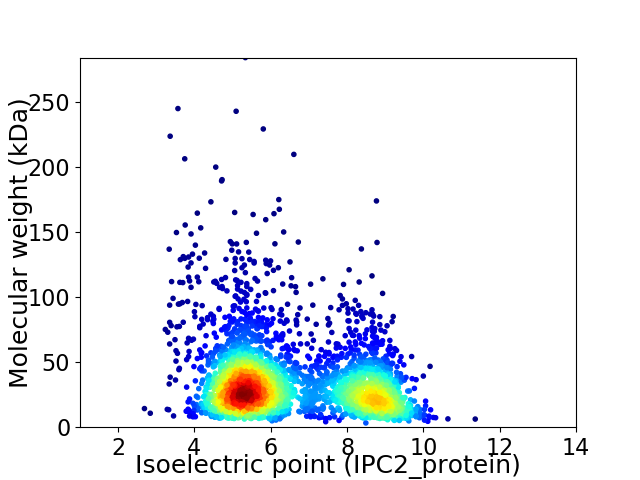
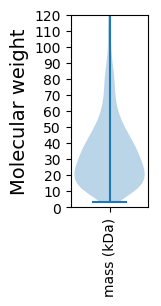
Virtual 2D-PAGE plot for 2930 proteins (isoelectric point calculated using IPC2_protein)
Get csv file with sequences according to given criteria:
* You can choose from 21 different methods for calculating isoelectric point
Summary statistics related to proteome-wise predictions


Protein with the lowest isoelectric point:
>tr|A0A2I0QYS6|A0A2I0QYS6_9FLAO Uncharacterized protein OS=Brumimicrobium salinarum OX=2058658 GN=CW751_14995 PE=3 SV=1
MM1 pKa = 7.5KK2 pKa = 10.42NLYY5 pKa = 10.42LFFAATILTFTANTQNFNEE24 pKa = 4.36VNPSPFVDD32 pKa = 3.09IGRR35 pKa = 11.84GKK37 pKa = 10.66SVMADD42 pKa = 3.12VDD44 pKa = 3.9NDD46 pKa = 3.4GHH48 pKa = 8.74LDD50 pKa = 3.66IIIAGNSYY58 pKa = 10.97EE59 pKa = 5.12NSTQTDD65 pKa = 3.54TVIVYY70 pKa = 10.64RR71 pKa = 11.84NDD73 pKa = 3.05GTGNYY78 pKa = 8.74TEE80 pKa = 4.04ITGNSFLGVYY90 pKa = 10.02RR91 pKa = 11.84PAFDD95 pKa = 4.53IADD98 pKa = 3.69IDD100 pKa = 4.3DD101 pKa = 5.41DD102 pKa = 5.08GDD104 pKa = 3.54IDD106 pKa = 4.94ILITGANNGSLTAKK120 pKa = 10.53LYY122 pKa = 10.63INDD125 pKa = 3.52GTGIFTEE132 pKa = 4.51VVTTIFEE139 pKa = 4.17AVEE142 pKa = 3.91NGTVNFADD150 pKa = 3.64VDD152 pKa = 3.75NDD154 pKa = 3.28GDD156 pKa = 4.06QDD158 pKa = 3.87VLLTGRR164 pKa = 11.84NNNATSISKK173 pKa = 10.41LYY175 pKa = 10.23INNGSGNFTEE185 pKa = 4.47NTGSPFTGVRR195 pKa = 11.84NGVVEE200 pKa = 4.3FADD203 pKa = 3.53INGNGSLDD211 pKa = 3.67LLINGEE217 pKa = 4.35LYY219 pKa = 10.62INDD222 pKa = 3.51GNGNFSLQTPANLTYY237 pKa = 10.53FGYY240 pKa = 11.06GDD242 pKa = 4.06AAFEE246 pKa = 5.82DD247 pKa = 4.06IDD249 pKa = 4.55NDD251 pKa = 3.68GDD253 pKa = 4.15LDD255 pKa = 4.96LIITGSMPNQIQPIYY270 pKa = 9.58TKK272 pKa = 10.71LYY274 pKa = 9.6LNDD277 pKa = 3.5GTGVFTEE284 pKa = 3.92ITGTLFTNLRR294 pKa = 11.84YY295 pKa = 10.17SSVDD299 pKa = 3.97FIDD302 pKa = 4.59FNGDD306 pKa = 3.39SYY308 pKa = 11.89PDD310 pKa = 3.78LLIGGVDD317 pKa = 3.6TNGDD321 pKa = 2.9KK322 pKa = 10.99HH323 pKa = 6.08ATFFINDD330 pKa = 3.23GSGNFTIAPQQPIEE344 pKa = 4.11AFSNGSLSIGDD355 pKa = 3.47VDD357 pKa = 4.5GDD359 pKa = 3.75LDD361 pKa = 4.51KK362 pKa = 11.54DD363 pKa = 3.9VLITGLYY370 pKa = 7.53EE371 pKa = 4.14KK372 pKa = 10.28PSVFGGTVTARR383 pKa = 11.84ITRR386 pKa = 11.84LYY388 pKa = 10.14KK389 pKa = 10.57LCNLEE394 pKa = 4.76LDD396 pKa = 3.92QPTLNPISAICSLDD410 pKa = 3.6EE411 pKa = 4.33PQAPTATDD419 pKa = 3.11NCSS422 pKa = 2.77
MM1 pKa = 7.5KK2 pKa = 10.42NLYY5 pKa = 10.42LFFAATILTFTANTQNFNEE24 pKa = 4.36VNPSPFVDD32 pKa = 3.09IGRR35 pKa = 11.84GKK37 pKa = 10.66SVMADD42 pKa = 3.12VDD44 pKa = 3.9NDD46 pKa = 3.4GHH48 pKa = 8.74LDD50 pKa = 3.66IIIAGNSYY58 pKa = 10.97EE59 pKa = 5.12NSTQTDD65 pKa = 3.54TVIVYY70 pKa = 10.64RR71 pKa = 11.84NDD73 pKa = 3.05GTGNYY78 pKa = 8.74TEE80 pKa = 4.04ITGNSFLGVYY90 pKa = 10.02RR91 pKa = 11.84PAFDD95 pKa = 4.53IADD98 pKa = 3.69IDD100 pKa = 4.3DD101 pKa = 5.41DD102 pKa = 5.08GDD104 pKa = 3.54IDD106 pKa = 4.94ILITGANNGSLTAKK120 pKa = 10.53LYY122 pKa = 10.63INDD125 pKa = 3.52GTGIFTEE132 pKa = 4.51VVTTIFEE139 pKa = 4.17AVEE142 pKa = 3.91NGTVNFADD150 pKa = 3.64VDD152 pKa = 3.75NDD154 pKa = 3.28GDD156 pKa = 4.06QDD158 pKa = 3.87VLLTGRR164 pKa = 11.84NNNATSISKK173 pKa = 10.41LYY175 pKa = 10.23INNGSGNFTEE185 pKa = 4.47NTGSPFTGVRR195 pKa = 11.84NGVVEE200 pKa = 4.3FADD203 pKa = 3.53INGNGSLDD211 pKa = 3.67LLINGEE217 pKa = 4.35LYY219 pKa = 10.62INDD222 pKa = 3.51GNGNFSLQTPANLTYY237 pKa = 10.53FGYY240 pKa = 11.06GDD242 pKa = 4.06AAFEE246 pKa = 5.82DD247 pKa = 4.06IDD249 pKa = 4.55NDD251 pKa = 3.68GDD253 pKa = 4.15LDD255 pKa = 4.96LIITGSMPNQIQPIYY270 pKa = 9.58TKK272 pKa = 10.71LYY274 pKa = 9.6LNDD277 pKa = 3.5GTGVFTEE284 pKa = 3.92ITGTLFTNLRR294 pKa = 11.84YY295 pKa = 10.17SSVDD299 pKa = 3.97FIDD302 pKa = 4.59FNGDD306 pKa = 3.39SYY308 pKa = 11.89PDD310 pKa = 3.78LLIGGVDD317 pKa = 3.6TNGDD321 pKa = 2.9KK322 pKa = 10.99HH323 pKa = 6.08ATFFINDD330 pKa = 3.23GSGNFTIAPQQPIEE344 pKa = 4.11AFSNGSLSIGDD355 pKa = 3.47VDD357 pKa = 4.5GDD359 pKa = 3.75LDD361 pKa = 4.51KK362 pKa = 11.54DD363 pKa = 3.9VLITGLYY370 pKa = 7.53EE371 pKa = 4.14KK372 pKa = 10.28PSVFGGTVTARR383 pKa = 11.84ITRR386 pKa = 11.84LYY388 pKa = 10.14KK389 pKa = 10.57LCNLEE394 pKa = 4.76LDD396 pKa = 3.92QPTLNPISAICSLDD410 pKa = 3.6EE411 pKa = 4.33PQAPTATDD419 pKa = 3.11NCSS422 pKa = 2.77
Molecular weight: 45.31 kDa
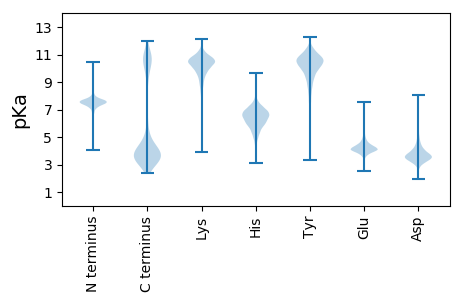
Isoelectric point according different methods:
Protein with the highest isoelectric point:
>tr|A0A2I0R2R8|A0A2I0R2R8_9FLAO S9 family peptidase OS=Brumimicrobium salinarum OX=2058658 GN=CW751_06830 PE=4 SV=1
MM1 pKa = 7.45KK2 pKa = 9.54RR3 pKa = 11.84TFQPSQRR10 pKa = 11.84KK11 pKa = 8.72RR12 pKa = 11.84RR13 pKa = 11.84NKK15 pKa = 9.56HH16 pKa = 3.99GFRR19 pKa = 11.84SRR21 pKa = 11.84MATKK25 pKa = 10.11NGRR28 pKa = 11.84RR29 pKa = 11.84VLAARR34 pKa = 11.84RR35 pKa = 11.84RR36 pKa = 11.84KK37 pKa = 8.87GRR39 pKa = 11.84KK40 pKa = 9.0RR41 pKa = 11.84LTVSSNKK48 pKa = 9.31LAKK51 pKa = 10.16RR52 pKa = 3.58
MM1 pKa = 7.45KK2 pKa = 9.54RR3 pKa = 11.84TFQPSQRR10 pKa = 11.84KK11 pKa = 8.72RR12 pKa = 11.84RR13 pKa = 11.84NKK15 pKa = 9.56HH16 pKa = 3.99GFRR19 pKa = 11.84SRR21 pKa = 11.84MATKK25 pKa = 10.11NGRR28 pKa = 11.84RR29 pKa = 11.84VLAARR34 pKa = 11.84RR35 pKa = 11.84RR36 pKa = 11.84KK37 pKa = 8.87GRR39 pKa = 11.84KK40 pKa = 9.0RR41 pKa = 11.84LTVSSNKK48 pKa = 9.31LAKK51 pKa = 10.16RR52 pKa = 3.58
Molecular weight: 6.26 kDa
Isoelectric point according different methods:
Peptides (in silico digests for buttom-up proteomics)
Below you can find in silico digests of the whole proteome with Trypsin, Chymotrypsin, Trypsin+LysC, LysN, ArgC proteases suitable for different mass spec machines.| Try ESI |
 |
|---|
| ChTry ESI |
 |
|---|
| ArgC ESI |
 |
|---|
| LysN ESI |
 |
|---|
| TryLysC ESI |
 |
|---|
| Try MALDI |
 |
|---|
| ChTry MALDI |
 |
|---|
| ArgC MALDI |
 |
|---|
| LysN MALDI |
 |
|---|
| TryLysC MALDI |
 |
|---|
| Try LTQ |
 |
|---|
| ChTry LTQ |
 |
|---|
| ArgC LTQ |
 |
|---|
| LysN LTQ |
 |
|---|
| TryLysC LTQ |
 |
|---|
| Try MSlow |
 |
|---|
| ChTry MSlow |
 |
|---|
| ArgC MSlow |
 |
|---|
| LysN MSlow |
 |
|---|
| TryLysC MSlow |
 |
|---|
| Try MShigh |
 |
|---|
| ChTry MShigh |
 |
|---|
| ArgC MShigh |
 |
|---|
| LysN MShigh |
 |
|---|
| TryLysC MShigh |
 |
|---|
General Statistics
Number of major isoforms |
Number of additional isoforms |
Number of all proteins |
Number of amino acids |
Min. Seq. Length |
Max. Seq. Length |
Avg. Seq. Length |
Avg. Mol. Weight |
|---|---|---|---|---|---|---|---|
0 |
972125 |
25 |
2495 |
331.8 |
37.49 |
Amino acid frequency
Ala |
Cys |
Asp |
Glu |
Phe |
Gly |
His |
Ile |
Lys |
Leu |
|---|---|---|---|---|---|---|---|---|---|
6.027 ± 0.043 | 0.801 ± 0.018 |
5.637 ± 0.037 | 6.855 ± 0.05 |
5.227 ± 0.037 | 6.467 ± 0.052 |
1.879 ± 0.02 | 7.891 ± 0.043 |
7.675 ± 0.064 | 8.995 ± 0.054 |
Met |
Asn |
Gln |
Pro |
Arg |
Ser |
Thr |
Val |
Trp |
Tyr |
|---|---|---|---|---|---|---|---|---|---|
2.236 ± 0.024 | 6.216 ± 0.045 |
3.424 ± 0.027 | 3.543 ± 0.03 |
3.494 ± 0.034 | 6.627 ± 0.042 |
5.737 ± 0.057 | 6.187 ± 0.033 |
1.028 ± 0.015 | 4.054 ± 0.028 |
Most of the basic statistics you can see at this page can be downloaded from this CSV file
Proteome-pI is available under Creative Commons Attribution-NoDerivs license, for more details see here
| Reference: Kozlowski LP. Proteome-pI 2.0: Proteome Isoelectric Point Database Update. Nucleic Acids Res. 2021, doi: 10.1093/nar/gkab944 | Contact: Lukasz P. Kozlowski |
