Lactobacillus phage JNU_P11
Taxonomy: Viruses; Duplodnaviria; Heunggongvirae; Uroviricota; Caudoviricetes; Caudovirales; Siphoviridae; unclassified Siphoviridae
Average proteome isoelectric point is 6.59
Get precalculated fractions of proteins

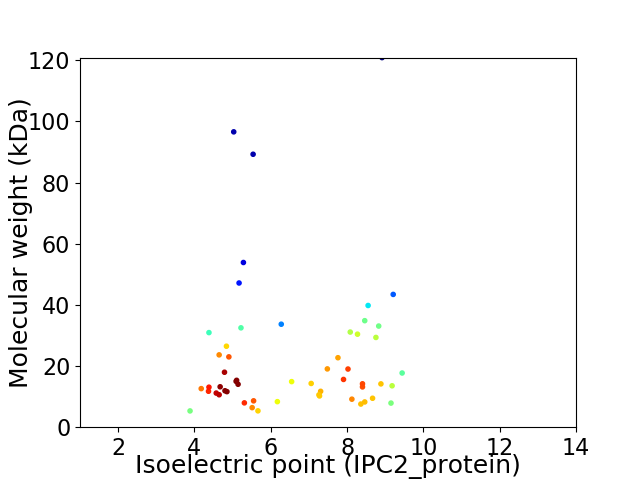
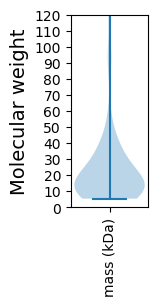
Virtual 2D-PAGE plot for 55 proteins (isoelectric point calculated using IPC2_protein)
Get csv file with sequences according to given criteria:
* You can choose from 21 different methods for calculating isoelectric point
Summary statistics related to proteome-wise predictions


Protein with the lowest isoelectric point:
>tr|A0A6M3BEU5|A0A6M3BEU5_9CAUD Antirepressor OS=Lactobacillus phage JNU_P11 OX=2686381 PE=4 SV=1
MM1 pKa = 8.2PDD3 pKa = 3.88LLLEE7 pKa = 4.36IYY9 pKa = 10.31KK10 pKa = 10.27EE11 pKa = 3.88QLDD14 pKa = 4.15WGWITLDD21 pKa = 3.8DD22 pKa = 4.41LKK24 pKa = 11.72ANVNSGLLAPDD35 pKa = 4.38DD36 pKa = 4.04FEE38 pKa = 7.17KK39 pKa = 10.69IAGQTYY45 pKa = 8.94VAA47 pKa = 4.9
MM1 pKa = 8.2PDD3 pKa = 3.88LLLEE7 pKa = 4.36IYY9 pKa = 10.31KK10 pKa = 10.27EE11 pKa = 3.88QLDD14 pKa = 4.15WGWITLDD21 pKa = 3.8DD22 pKa = 4.41LKK24 pKa = 11.72ANVNSGLLAPDD35 pKa = 4.38DD36 pKa = 4.04FEE38 pKa = 7.17KK39 pKa = 10.69IAGQTYY45 pKa = 8.94VAA47 pKa = 4.9
Molecular weight: 5.32 kDa
Isoelectric point according different methods:
Protein with the highest isoelectric point:
>tr|A0A6M3BEU7|A0A6M3BEU7_9CAUD M23 family peptidase OS=Lactobacillus phage JNU_P11 OX=2686381 PE=4 SV=1
MM1 pKa = 7.67RR2 pKa = 11.84VNFTIEE8 pKa = 3.93GPPIGKK14 pKa = 9.4ARR16 pKa = 11.84PRR18 pKa = 11.84VTRR21 pKa = 11.84TVTYY25 pKa = 9.63TPAKK29 pKa = 7.16TARR32 pKa = 11.84YY33 pKa = 8.04EE34 pKa = 3.93DD35 pKa = 3.92LVRR38 pKa = 11.84YY39 pKa = 6.81TAINSFKK46 pKa = 11.02GIFDD50 pKa = 3.55KK51 pKa = 11.36DD52 pKa = 3.27EE53 pKa = 4.55PLDD56 pKa = 4.02VKK58 pKa = 10.87IMAYY62 pKa = 10.43FEE64 pKa = 4.51VPKK67 pKa = 10.8SLSKK71 pKa = 10.38KK72 pKa = 10.06RR73 pKa = 11.84KK74 pKa = 9.02ALCLSNQEE82 pKa = 4.65LPTKK86 pKa = 10.58KK87 pKa = 9.86PDD89 pKa = 3.42ADD91 pKa = 3.63NVGKK95 pKa = 10.45IIMDD99 pKa = 3.8GMNPKK104 pKa = 9.3MKK106 pKa = 9.49RR107 pKa = 11.84DD108 pKa = 3.49KK109 pKa = 10.41RR110 pKa = 11.84LHH112 pKa = 6.12KK113 pKa = 9.64MVEE116 pKa = 4.02VMRR119 pKa = 11.84GVYY122 pKa = 10.07HH123 pKa = 7.97DD124 pKa = 4.84DD125 pKa = 3.64KK126 pKa = 11.4QVTTLLVKK134 pKa = 10.3KK135 pKa = 10.07RR136 pKa = 11.84YY137 pKa = 9.48AKK139 pKa = 10.2RR140 pKa = 11.84ARR142 pKa = 11.84VDD144 pKa = 3.25VRR146 pKa = 11.84IKK148 pKa = 10.82RR149 pKa = 11.84DD150 pKa = 3.18MGDD153 pKa = 2.8
MM1 pKa = 7.67RR2 pKa = 11.84VNFTIEE8 pKa = 3.93GPPIGKK14 pKa = 9.4ARR16 pKa = 11.84PRR18 pKa = 11.84VTRR21 pKa = 11.84TVTYY25 pKa = 9.63TPAKK29 pKa = 7.16TARR32 pKa = 11.84YY33 pKa = 8.04EE34 pKa = 3.93DD35 pKa = 3.92LVRR38 pKa = 11.84YY39 pKa = 6.81TAINSFKK46 pKa = 11.02GIFDD50 pKa = 3.55KK51 pKa = 11.36DD52 pKa = 3.27EE53 pKa = 4.55PLDD56 pKa = 4.02VKK58 pKa = 10.87IMAYY62 pKa = 10.43FEE64 pKa = 4.51VPKK67 pKa = 10.8SLSKK71 pKa = 10.38KK72 pKa = 10.06RR73 pKa = 11.84KK74 pKa = 9.02ALCLSNQEE82 pKa = 4.65LPTKK86 pKa = 10.58KK87 pKa = 9.86PDD89 pKa = 3.42ADD91 pKa = 3.63NVGKK95 pKa = 10.45IIMDD99 pKa = 3.8GMNPKK104 pKa = 9.3MKK106 pKa = 9.49RR107 pKa = 11.84DD108 pKa = 3.49KK109 pKa = 10.41RR110 pKa = 11.84LHH112 pKa = 6.12KK113 pKa = 9.64MVEE116 pKa = 4.02VMRR119 pKa = 11.84GVYY122 pKa = 10.07HH123 pKa = 7.97DD124 pKa = 4.84DD125 pKa = 3.64KK126 pKa = 11.4QVTTLLVKK134 pKa = 10.3KK135 pKa = 10.07RR136 pKa = 11.84YY137 pKa = 9.48AKK139 pKa = 10.2RR140 pKa = 11.84ARR142 pKa = 11.84VDD144 pKa = 3.25VRR146 pKa = 11.84IKK148 pKa = 10.82RR149 pKa = 11.84DD150 pKa = 3.18MGDD153 pKa = 2.8
Molecular weight: 17.73 kDa
Isoelectric point according different methods:
Peptides (in silico digests for buttom-up proteomics)
Below you can find in silico digests of the whole proteome with Trypsin, Chymotrypsin, Trypsin+LysC, LysN, ArgC proteases suitable for different mass spec machines.| Try ESI |
 |
|---|
| ChTry ESI |
 |
|---|
| ArgC ESI |
 |
|---|
| LysN ESI |
 |
|---|
| TryLysC ESI |
 |
|---|
| Try MALDI |
 |
|---|
| ChTry MALDI |
 |
|---|
| ArgC MALDI |
 |
|---|
| LysN MALDI |
 |
|---|
| TryLysC MALDI |
 |
|---|
| Try LTQ |
 |
|---|
| ChTry LTQ |
 |
|---|
| ArgC LTQ |
 |
|---|
| LysN LTQ |
 |
|---|
| TryLysC LTQ |
 |
|---|
| Try MSlow |
 |
|---|
| ChTry MSlow |
 |
|---|
| ArgC MSlow |
 |
|---|
| LysN MSlow |
 |
|---|
| TryLysC MSlow |
 |
|---|
| Try MShigh |
 |
|---|
| ChTry MShigh |
 |
|---|
| ArgC MShigh |
 |
|---|
| LysN MShigh |
 |
|---|
| TryLysC MShigh |
 |
|---|
General Statistics
Number of major isoforms |
Number of additional isoforms |
Number of all proteins |
Number of amino acids |
Min. Seq. Length |
Max. Seq. Length |
Avg. Seq. Length |
Avg. Mol. Weight |
|---|---|---|---|---|---|---|---|
0 |
11261 |
43 |
1134 |
204.7 |
23.16 |
Amino acid frequency
Ala |
Cys |
Asp |
Glu |
Phe |
Gly |
His |
Ile |
Lys |
Leu |
|---|---|---|---|---|---|---|---|---|---|
7.14 ± 0.62 | 0.613 ± 0.098 |
7.22 ± 0.423 | 5.745 ± 0.367 |
3.739 ± 0.206 | 6.136 ± 0.338 |
1.492 ± 0.22 | 6.98 ± 0.357 |
8.862 ± 0.401 | 7.921 ± 0.317 |
Met |
Asn |
Gln |
Pro |
Arg |
Ser |
Thr |
Val |
Trp |
Tyr |
|---|---|---|---|---|---|---|---|---|---|
2.415 ± 0.144 | 6.287 ± 0.311 |
2.904 ± 0.222 | 4.6 ± 0.218 |
3.659 ± 0.243 | 6.056 ± 0.289 |
6.03 ± 0.314 | 6.403 ± 0.289 |
1.705 ± 0.19 | 4.094 ± 0.377 |
Most of the basic statistics you can see at this page can be downloaded from this CSV file
Proteome-pI is available under Creative Commons Attribution-NoDerivs license, for more details see here
| Reference: Kozlowski LP. Proteome-pI 2.0: Proteome Isoelectric Point Database Update. Nucleic Acids Res. 2021, doi: 10.1093/nar/gkab944 | Contact: Lukasz P. Kozlowski |
