Rhodobacteraceae bacterium SH-1
Taxonomy: cellular organisms; Bacteria; Proteobacteria; Alphaproteobacteria; Rhodobacterales; Rhodobacteraceae; Pukyongiella
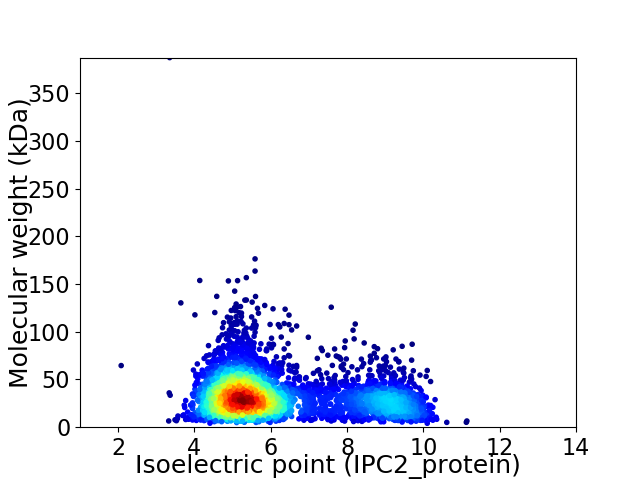
Average proteome isoelectric point is 6.23
Get precalculated fractions of proteins

Virtual 2D-PAGE plot for 3994 proteins (isoelectric point calculated using IPC2_protein)
Get csv file with sequences according to given criteria:
* You can choose from 21 different methods for calculating isoelectric point
Summary statistics related to proteome-wise predictions


Protein with the lowest isoelectric point:
>tr|A0A2S0MN55|A0A2S0MN55_9RHOB Amidohydrolase OS=Rhodobacteraceae bacterium SH-1 OX=2605946 GN=C6Y53_06065 PE=4 SV=1
MM1 pKa = 7.37SKK3 pKa = 10.31SRR5 pKa = 11.84NIVLGAVLAAGVTGPVLAGPLGLGRR30 pKa = 11.84PATPDD35 pKa = 3.74EE36 pKa = 4.04IAAWDD41 pKa = 3.71TDD43 pKa = 3.46VRR45 pKa = 11.84PDD47 pKa = 3.55GTGLPDD53 pKa = 3.78GEE55 pKa = 4.28GDD57 pKa = 3.19VWTGEE62 pKa = 4.08EE63 pKa = 4.55LFEE66 pKa = 4.76ANCAVCHH73 pKa = 6.39GDD75 pKa = 3.28FAEE78 pKa = 6.41GVDD81 pKa = 4.17NWPQLAGGFGTLDD94 pKa = 2.93QDD96 pKa = 5.02DD97 pKa = 4.04PVKK100 pKa = 10.14TVGSYY105 pKa = 8.23WPYY108 pKa = 11.5LSTTWDD114 pKa = 3.61YY115 pKa = 11.18IYY117 pKa = 11.11RR118 pKa = 11.84SMPYY122 pKa = 10.76GNAQSLEE129 pKa = 4.13PVDD132 pKa = 5.05VYY134 pKa = 11.91ALVAYY139 pKa = 9.63ILYY142 pKa = 11.02SNDD145 pKa = 3.33LVDD148 pKa = 5.71DD149 pKa = 4.66DD150 pKa = 5.66FVLSRR155 pKa = 11.84DD156 pKa = 3.36NFLDD160 pKa = 3.48VEE162 pKa = 4.4MPNAGGFRR170 pKa = 11.84VDD172 pKa = 4.94DD173 pKa = 4.03RR174 pKa = 11.84AEE176 pKa = 3.9TEE178 pKa = 4.06YY179 pKa = 10.48PLWRR183 pKa = 11.84GEE185 pKa = 3.99PCMEE189 pKa = 4.07NCKK192 pKa = 10.61DD193 pKa = 3.5AVTVTMRR200 pKa = 11.84AAVLDD205 pKa = 3.81VTPDD209 pKa = 3.53DD210 pKa = 4.05GAEE213 pKa = 3.79
MM1 pKa = 7.37SKK3 pKa = 10.31SRR5 pKa = 11.84NIVLGAVLAAGVTGPVLAGPLGLGRR30 pKa = 11.84PATPDD35 pKa = 3.74EE36 pKa = 4.04IAAWDD41 pKa = 3.71TDD43 pKa = 3.46VRR45 pKa = 11.84PDD47 pKa = 3.55GTGLPDD53 pKa = 3.78GEE55 pKa = 4.28GDD57 pKa = 3.19VWTGEE62 pKa = 4.08EE63 pKa = 4.55LFEE66 pKa = 4.76ANCAVCHH73 pKa = 6.39GDD75 pKa = 3.28FAEE78 pKa = 6.41GVDD81 pKa = 4.17NWPQLAGGFGTLDD94 pKa = 2.93QDD96 pKa = 5.02DD97 pKa = 4.04PVKK100 pKa = 10.14TVGSYY105 pKa = 8.23WPYY108 pKa = 11.5LSTTWDD114 pKa = 3.61YY115 pKa = 11.18IYY117 pKa = 11.11RR118 pKa = 11.84SMPYY122 pKa = 10.76GNAQSLEE129 pKa = 4.13PVDD132 pKa = 5.05VYY134 pKa = 11.91ALVAYY139 pKa = 9.63ILYY142 pKa = 11.02SNDD145 pKa = 3.33LVDD148 pKa = 5.71DD149 pKa = 4.66DD150 pKa = 5.66FVLSRR155 pKa = 11.84DD156 pKa = 3.36NFLDD160 pKa = 3.48VEE162 pKa = 4.4MPNAGGFRR170 pKa = 11.84VDD172 pKa = 4.94DD173 pKa = 4.03RR174 pKa = 11.84AEE176 pKa = 3.9TEE178 pKa = 4.06YY179 pKa = 10.48PLWRR183 pKa = 11.84GEE185 pKa = 3.99PCMEE189 pKa = 4.07NCKK192 pKa = 10.61DD193 pKa = 3.5AVTVTMRR200 pKa = 11.84AAVLDD205 pKa = 3.81VTPDD209 pKa = 3.53DD210 pKa = 4.05GAEE213 pKa = 3.79
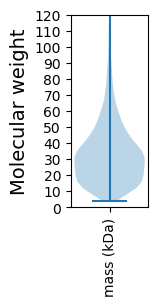
Molecular weight: 23.05 kDa
Isoelectric point according different methods:
Protein with the highest isoelectric point:
>tr|A0A2S0MRT3|A0A2S0MRT3_9RHOB Flagellar hook-length control protein FliK OS=Rhodobacteraceae bacterium SH-1 OX=2605946 GN=C6Y53_13220 PE=4 SV=2
MM1 pKa = 7.31LRR3 pKa = 11.84STMLAPAQTAAIGIKK18 pKa = 10.54AMLKK22 pKa = 9.88GRR24 pKa = 11.84RR25 pKa = 11.84SVIAGGMNRR34 pKa = 11.84LTAFSSRR41 pKa = 11.84LMPRR45 pKa = 11.84GVMLRR50 pKa = 11.84MMGRR54 pKa = 11.84SLRR57 pKa = 11.84NASS60 pKa = 3.23
MM1 pKa = 7.31LRR3 pKa = 11.84STMLAPAQTAAIGIKK18 pKa = 10.54AMLKK22 pKa = 9.88GRR24 pKa = 11.84RR25 pKa = 11.84SVIAGGMNRR34 pKa = 11.84LTAFSSRR41 pKa = 11.84LMPRR45 pKa = 11.84GVMLRR50 pKa = 11.84MMGRR54 pKa = 11.84SLRR57 pKa = 11.84NASS60 pKa = 3.23
Molecular weight: 6.49 kDa
Isoelectric point according different methods:
Peptides (in silico digests for buttom-up proteomics)
Below you can find in silico digests of the whole proteome with Trypsin, Chymotrypsin, Trypsin+LysC, LysN, ArgC proteases suitable for different mass spec machines.| Try ESI |
 |
|---|
| ChTry ESI |
 |
|---|
| ArgC ESI |
 |
|---|
| LysN ESI |
 |
|---|
| TryLysC ESI |
 |
|---|
| Try MALDI |
 |
|---|
| ChTry MALDI |
 |
|---|
| ArgC MALDI |
 |
|---|
| LysN MALDI |
 |
|---|
| TryLysC MALDI |
 |
|---|
| Try LTQ |
 |
|---|
| ChTry LTQ |
 |
|---|
| ArgC LTQ |
 |
|---|
| LysN LTQ |
 |
|---|
| TryLysC LTQ |
 |
|---|
| Try MSlow |
 |
|---|
| ChTry MSlow |
 |
|---|
| ArgC MSlow |
 |
|---|
| LysN MSlow |
 |
|---|
| TryLysC MSlow |
 |
|---|
| Try MShigh |
 |
|---|
| ChTry MShigh |
 |
|---|
| ArgC MShigh |
 |
|---|
| LysN MShigh |
 |
|---|
| TryLysC MShigh |
 |
|---|
General Statistics
Number of major isoforms |
Number of additional isoforms |
Number of all proteins |
Number of amino acids |
Min. Seq. Length |
Max. Seq. Length |
Avg. Seq. Length |
Avg. Mol. Weight |
|---|---|---|---|---|---|---|---|
0 |
1272518 |
35 |
3759 |
318.6 |
34.5 |
Amino acid frequency
Ala |
Cys |
Asp |
Glu |
Phe |
Gly |
His |
Ile |
Lys |
Leu |
|---|---|---|---|---|---|---|---|---|---|
12.839 ± 0.061 | 0.921 ± 0.012 |
6.454 ± 0.041 | 5.512 ± 0.041 |
3.598 ± 0.024 | 9.04 ± 0.038 |
2.069 ± 0.019 | 4.94 ± 0.031 |
2.602 ± 0.035 | 10.113 ± 0.05 |
Met |
Asn |
Gln |
Pro |
Arg |
Ser |
Thr |
Val |
Trp |
Tyr |
|---|---|---|---|---|---|---|---|---|---|
2.723 ± 0.017 | 2.451 ± 0.024 |
5.296 ± 0.031 | 3.001 ± 0.02 |
7.521 ± 0.045 | 4.818 ± 0.027 |
5.305 ± 0.025 | 7.259 ± 0.033 |
1.4 ± 0.017 | 2.138 ± 0.018 |
Most of the basic statistics you can see at this page can be downloaded from this CSV file
Proteome-pI is available under Creative Commons Attribution-NoDerivs license, for more details see here
| Reference: Kozlowski LP. Proteome-pI 2.0: Proteome Isoelectric Point Database Update. Nucleic Acids Res. 2021, doi: 10.1093/nar/gkab944 | Contact: Lukasz P. Kozlowski |
