Streptococcus phage CHPC640
Taxonomy: Viruses; Duplodnaviria; Heunggongvirae; Uroviricota; Caudoviricetes; Caudovirales; Siphoviridae; Brussowvirus; unclassified Brussowvirus
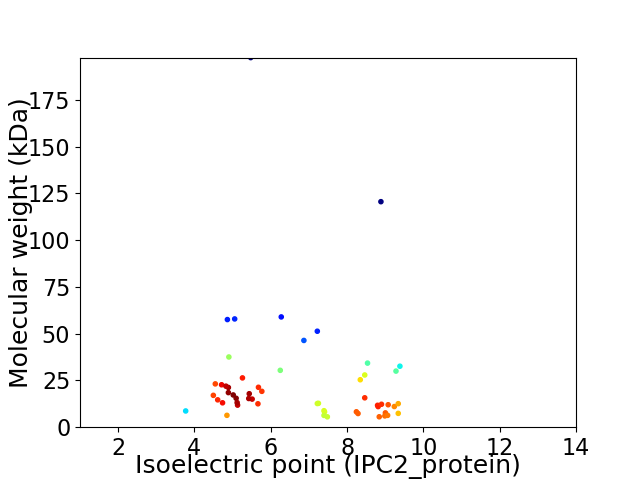
Average proteome isoelectric point is 6.8
Get precalculated fractions of proteins

Virtual 2D-PAGE plot for 55 proteins (isoelectric point calculated using IPC2_protein)
Get csv file with sequences according to given criteria:
* You can choose from 21 different methods for calculating isoelectric point
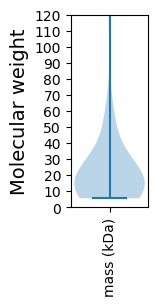
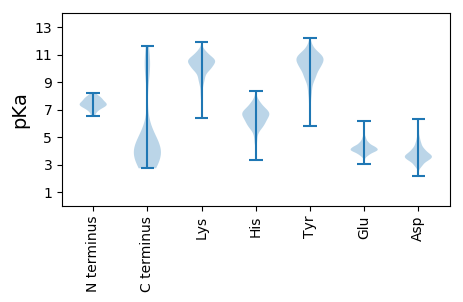
Summary statistics related to proteome-wise predictions


Protein with the lowest isoelectric point:
>tr|A0A3G8F962|A0A3G8F962_9CAUD Uncharacterized protein OS=Streptococcus phage CHPC640 OX=2365037 GN=CHPC640_0039 PE=4 SV=1
MM1 pKa = 7.11VNWVDD6 pKa = 4.52ADD8 pKa = 4.28GNDD11 pKa = 4.32LPDD14 pKa = 3.91GTDD17 pKa = 3.28QEE19 pKa = 5.22FKK21 pKa = 11.07AGMYY25 pKa = 10.2FSFAGDD31 pKa = 3.52EE32 pKa = 4.3VNITDD37 pKa = 3.61TGYY40 pKa = 9.31GGYY43 pKa = 10.32YY44 pKa = 9.25GGYY47 pKa = 8.85YY48 pKa = 9.03YY49 pKa = 10.88RR50 pKa = 11.84KK51 pKa = 9.85FEE53 pKa = 4.13FGQFGTVWLSCWNKK67 pKa = 10.66DD68 pKa = 3.89DD69 pKa = 5.14LVNYY73 pKa = 7.38YY74 pKa = 8.26QQ75 pKa = 4.22
MM1 pKa = 7.11VNWVDD6 pKa = 4.52ADD8 pKa = 4.28GNDD11 pKa = 4.32LPDD14 pKa = 3.91GTDD17 pKa = 3.28QEE19 pKa = 5.22FKK21 pKa = 11.07AGMYY25 pKa = 10.2FSFAGDD31 pKa = 3.52EE32 pKa = 4.3VNITDD37 pKa = 3.61TGYY40 pKa = 9.31GGYY43 pKa = 10.32YY44 pKa = 9.25GGYY47 pKa = 8.85YY48 pKa = 9.03YY49 pKa = 10.88RR50 pKa = 11.84KK51 pKa = 9.85FEE53 pKa = 4.13FGQFGTVWLSCWNKK67 pKa = 10.66DD68 pKa = 3.89DD69 pKa = 5.14LVNYY73 pKa = 7.38YY74 pKa = 8.26QQ75 pKa = 4.22
Molecular weight: 8.68 kDa
Isoelectric point according different methods:
Protein with the highest isoelectric point:
>tr|A0A3G8F6I5|A0A3G8F6I5_9CAUD Uncharacterized protein OS=Streptococcus phage CHPC640 OX=2365037 GN=CHPC640_0024 PE=4 SV=1
MM1 pKa = 6.87MAVAGFTQFNAQVMRR16 pKa = 11.84SASGMSALSAAISTMPSSLASVASAANIATSSIMRR51 pKa = 11.84IATSAPRR58 pKa = 11.84IASAMSSAAGQVQSAMQRR76 pKa = 11.84MAQSVQSGGQRR87 pKa = 11.84MIQMGRR93 pKa = 11.84QAGTHH98 pKa = 5.65TGQNIASGIQSSVGAVSSAVGALVDD123 pKa = 3.85AARR126 pKa = 11.84SRR128 pKa = 11.84AMGGVGAMQIVGAMIGKK145 pKa = 9.44GLANGMIASLGAVTAAANALVAQAEE170 pKa = 4.19RR171 pKa = 11.84AAQAKK176 pKa = 9.85ARR178 pKa = 11.84IHH180 pKa = 5.7SPSRR184 pKa = 11.84LFRR187 pKa = 11.84DD188 pKa = 3.1KK189 pKa = 11.32VGIYY193 pKa = 9.76LGQGMAVGIDD203 pKa = 3.14RR204 pKa = 11.84SVKK207 pKa = 8.86YY208 pKa = 10.48VKK210 pKa = 10.54SSIEE214 pKa = 3.89NMVDD218 pKa = 2.85TASRR222 pKa = 11.84YY223 pKa = 9.71AISSRR228 pKa = 11.84EE229 pKa = 3.87LFEE232 pKa = 5.42DD233 pKa = 3.47NNVFDD238 pKa = 3.96SFGWGNIRR246 pKa = 11.84GSVDD250 pKa = 3.0LALRR254 pKa = 11.84DD255 pKa = 4.04DD256 pKa = 4.24DD257 pKa = 5.67RR258 pKa = 11.84MDD260 pKa = 3.98RR261 pKa = 11.84LEE263 pKa = 3.95QALDD267 pKa = 4.57LITEE271 pKa = 4.53LVGRR275 pKa = 11.84PISLNINGRR284 pKa = 11.84EE285 pKa = 3.92FAYY288 pKa = 9.28ATADD292 pKa = 5.01DD293 pKa = 3.42ISGYY297 pKa = 9.67QKK299 pKa = 10.56SQEE302 pKa = 3.96FTYY305 pKa = 11.09KK306 pKa = 10.37RR307 pKa = 11.84MRR309 pKa = 11.84GLNN312 pKa = 3.43
MM1 pKa = 6.87MAVAGFTQFNAQVMRR16 pKa = 11.84SASGMSALSAAISTMPSSLASVASAANIATSSIMRR51 pKa = 11.84IATSAPRR58 pKa = 11.84IASAMSSAAGQVQSAMQRR76 pKa = 11.84MAQSVQSGGQRR87 pKa = 11.84MIQMGRR93 pKa = 11.84QAGTHH98 pKa = 5.65TGQNIASGIQSSVGAVSSAVGALVDD123 pKa = 3.85AARR126 pKa = 11.84SRR128 pKa = 11.84AMGGVGAMQIVGAMIGKK145 pKa = 9.44GLANGMIASLGAVTAAANALVAQAEE170 pKa = 4.19RR171 pKa = 11.84AAQAKK176 pKa = 9.85ARR178 pKa = 11.84IHH180 pKa = 5.7SPSRR184 pKa = 11.84LFRR187 pKa = 11.84DD188 pKa = 3.1KK189 pKa = 11.32VGIYY193 pKa = 9.76LGQGMAVGIDD203 pKa = 3.14RR204 pKa = 11.84SVKK207 pKa = 8.86YY208 pKa = 10.48VKK210 pKa = 10.54SSIEE214 pKa = 3.89NMVDD218 pKa = 2.85TASRR222 pKa = 11.84YY223 pKa = 9.71AISSRR228 pKa = 11.84EE229 pKa = 3.87LFEE232 pKa = 5.42DD233 pKa = 3.47NNVFDD238 pKa = 3.96SFGWGNIRR246 pKa = 11.84GSVDD250 pKa = 3.0LALRR254 pKa = 11.84DD255 pKa = 4.04DD256 pKa = 4.24DD257 pKa = 5.67RR258 pKa = 11.84MDD260 pKa = 3.98RR261 pKa = 11.84LEE263 pKa = 3.95QALDD267 pKa = 4.57LITEE271 pKa = 4.53LVGRR275 pKa = 11.84PISLNINGRR284 pKa = 11.84EE285 pKa = 3.92FAYY288 pKa = 9.28ATADD292 pKa = 5.01DD293 pKa = 3.42ISGYY297 pKa = 9.67QKK299 pKa = 10.56SQEE302 pKa = 3.96FTYY305 pKa = 11.09KK306 pKa = 10.37RR307 pKa = 11.84MRR309 pKa = 11.84GLNN312 pKa = 3.43
Molecular weight: 32.59 kDa
Isoelectric point according different methods:
Peptides (in silico digests for buttom-up proteomics)
Below you can find in silico digests of the whole proteome with Trypsin, Chymotrypsin, Trypsin+LysC, LysN, ArgC proteases suitable for different mass spec machines.| Try ESI |
 |
|---|
| ChTry ESI |
 |
|---|
| ArgC ESI |
 |
|---|
| LysN ESI |
 |
|---|
| TryLysC ESI |
 |
|---|
| Try MALDI |
 |
|---|
| ChTry MALDI |
 |
|---|
| ArgC MALDI |
 |
|---|
| LysN MALDI |
 |
|---|
| TryLysC MALDI |
 |
|---|
| Try LTQ |
 |
|---|
| ChTry LTQ |
 |
|---|
| ArgC LTQ |
 |
|---|
| LysN LTQ |
 |
|---|
| TryLysC LTQ |
 |
|---|
| Try MSlow |
 |
|---|
| ChTry MSlow |
 |
|---|
| ArgC MSlow |
 |
|---|
| LysN MSlow |
 |
|---|
| TryLysC MSlow |
 |
|---|
| Try MShigh |
 |
|---|
| ChTry MShigh |
 |
|---|
| ArgC MShigh |
 |
|---|
| LysN MShigh |
 |
|---|
| TryLysC MShigh |
 |
|---|
General Statistics
Number of major isoforms |
Number of additional isoforms |
Number of all proteins |
Number of amino acids |
Min. Seq. Length |
Max. Seq. Length |
Avg. Seq. Length |
Avg. Mol. Weight |
|---|---|---|---|---|---|---|---|
0 |
12041 |
47 |
1779 |
218.9 |
24.53 |
Amino acid frequency
Ala |
Cys |
Asp |
Glu |
Phe |
Gly |
His |
Ile |
Lys |
Leu |
|---|---|---|---|---|---|---|---|---|---|
7.516 ± 0.825 | 0.556 ± 0.123 |
6.22 ± 0.426 | 6.594 ± 0.595 |
3.895 ± 0.17 | 7.117 ± 0.579 |
1.287 ± 0.161 | 6.852 ± 0.418 |
8.205 ± 0.507 | 7.773 ± 0.342 |
Met |
Asn |
Gln |
Pro |
Arg |
Ser |
Thr |
Val |
Trp |
Tyr |
|---|---|---|---|---|---|---|---|---|---|
2.491 ± 0.226 | 5.606 ± 0.32 |
2.832 ± 0.245 | 3.646 ± 0.199 |
4.244 ± 0.433 | 6.843 ± 0.532 |
6.378 ± 0.403 | 6.478 ± 0.238 |
1.337 ± 0.183 | 4.128 ± 0.406 |
Most of the basic statistics you can see at this page can be downloaded from this CSV file
Proteome-pI is available under Creative Commons Attribution-NoDerivs license, for more details see here
| Reference: Kozlowski LP. Proteome-pI 2.0: Proteome Isoelectric Point Database Update. Nucleic Acids Res. 2021, doi: 10.1093/nar/gkab944 | Contact: Lukasz P. Kozlowski |
