Methylobacter tundripaludum (strain ATCC BAA-1195 / DSM 17260 / SV96)
Taxonomy: cellular organisms; Bacteria; Proteobacteria; Gammaproteobacteria; Methylococcales; Methylococcaceae; Methylobacter; Methylobacter tundripaludum
Average proteome isoelectric point is 6.3
Get precalculated fractions of proteins

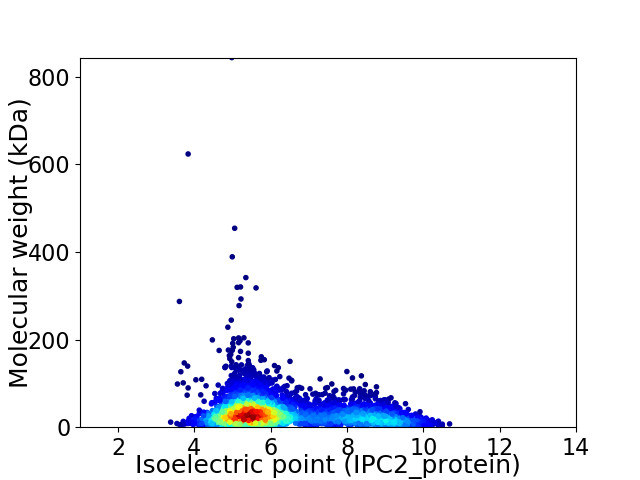
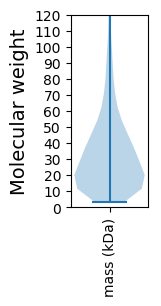
Virtual 2D-PAGE plot for 4194 proteins (isoelectric point calculated using IPC2_protein)
Get csv file with sequences according to given criteria:
* You can choose from 21 different methods for calculating isoelectric point
Summary statistics related to proteome-wise predictions


Protein with the lowest isoelectric point:
>tr|G3J233|G3J233_METTV Putative signal transduction protein OS=Methylobacter tundripaludum (strain ATCC BAA-1195 / DSM 17260 / SV96) OX=697282 GN=Mettu_2904 PE=4 SV=1
MM1 pKa = 7.15TVDD4 pKa = 4.64FNHH7 pKa = 6.9LKK9 pKa = 9.74HH10 pKa = 6.9FSMTYY15 pKa = 10.25VFMDD19 pKa = 4.03EE20 pKa = 4.27EE21 pKa = 6.34DD22 pKa = 3.41IACEE26 pKa = 4.04YY27 pKa = 10.06EE28 pKa = 4.07QTEE31 pKa = 4.77PIPVVAADD39 pKa = 3.88GKK41 pKa = 10.97SISFNLRR48 pKa = 11.84NIDD51 pKa = 3.45QSEE54 pKa = 4.19DD55 pKa = 3.32KK56 pKa = 10.81DD57 pKa = 4.08VYY59 pKa = 11.17SVVLVKK65 pKa = 10.94EE66 pKa = 4.52GDD68 pKa = 3.43DD69 pKa = 3.42EE70 pKa = 5.69FYY72 pKa = 10.75IKK74 pKa = 10.42SDD76 pKa = 3.75YY77 pKa = 10.82FDD79 pKa = 5.35DD80 pKa = 4.32AAEE83 pKa = 4.64PYY85 pKa = 10.53PMDD88 pKa = 4.75VEE90 pKa = 5.1ISDD93 pKa = 5.13DD94 pKa = 3.64DD95 pKa = 4.16VKK97 pKa = 11.22FILEE101 pKa = 4.34GEE103 pKa = 4.27DD104 pKa = 3.27EE105 pKa = 4.45VMYY108 pKa = 10.69LYY110 pKa = 11.23GFFEE114 pKa = 4.35
MM1 pKa = 7.15TVDD4 pKa = 4.64FNHH7 pKa = 6.9LKK9 pKa = 9.74HH10 pKa = 6.9FSMTYY15 pKa = 10.25VFMDD19 pKa = 4.03EE20 pKa = 4.27EE21 pKa = 6.34DD22 pKa = 3.41IACEE26 pKa = 4.04YY27 pKa = 10.06EE28 pKa = 4.07QTEE31 pKa = 4.77PIPVVAADD39 pKa = 3.88GKK41 pKa = 10.97SISFNLRR48 pKa = 11.84NIDD51 pKa = 3.45QSEE54 pKa = 4.19DD55 pKa = 3.32KK56 pKa = 10.81DD57 pKa = 4.08VYY59 pKa = 11.17SVVLVKK65 pKa = 10.94EE66 pKa = 4.52GDD68 pKa = 3.43DD69 pKa = 3.42EE70 pKa = 5.69FYY72 pKa = 10.75IKK74 pKa = 10.42SDD76 pKa = 3.75YY77 pKa = 10.82FDD79 pKa = 5.35DD80 pKa = 4.32AAEE83 pKa = 4.64PYY85 pKa = 10.53PMDD88 pKa = 4.75VEE90 pKa = 5.1ISDD93 pKa = 5.13DD94 pKa = 3.64DD95 pKa = 4.16VKK97 pKa = 11.22FILEE101 pKa = 4.34GEE103 pKa = 4.27DD104 pKa = 3.27EE105 pKa = 4.45VMYY108 pKa = 10.69LYY110 pKa = 11.23GFFEE114 pKa = 4.35
Molecular weight: 13.3 kDa
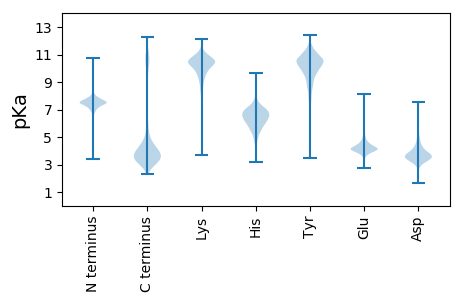
Isoelectric point according different methods:
Protein with the highest isoelectric point:
>tr|G3IVX0|G3IVX0_METTV Two component sigma54 specific transcriptional regulator Fis family OS=Methylobacter tundripaludum (strain ATCC BAA-1195 / DSM 17260 / SV96) OX=697282 GN=Mettu_1815 PE=4 SV=1
MM1 pKa = 7.13ATALSANLCIVSWTYY16 pKa = 11.13PFLKK20 pKa = 10.11HH21 pKa = 5.96YY22 pKa = 10.81VLGDD26 pKa = 3.5SCRR29 pKa = 11.84AEE31 pKa = 4.13CGLRR35 pKa = 11.84LAKK38 pKa = 10.17ARR40 pKa = 11.84HH41 pKa = 5.69RR42 pKa = 11.84KK43 pKa = 9.59AGLCLEE49 pKa = 4.39YY50 pKa = 10.98ARR52 pKa = 11.84VIASLLNWGVSSALQSCPCQPYY74 pKa = 10.25SRR76 pKa = 11.84SSTCFTLSRR85 pKa = 11.84CMGSSLAFGIKK96 pKa = 9.19IQNPNNLNHH105 pKa = 5.63YY106 pKa = 9.32HH107 pKa = 5.83SPVWLLRR114 pKa = 11.84TKK116 pKa = 10.4PLALRR121 pKa = 11.84QEE123 pKa = 4.03QSLANSLRR131 pKa = 11.84DD132 pKa = 3.45PRR134 pKa = 11.84CPLKK138 pKa = 10.83NKK140 pKa = 9.37PPRR143 pKa = 11.84NIWRR147 pKa = 11.84RR148 pKa = 11.84RR149 pKa = 11.84LMNKK153 pKa = 7.19SQCIIKK159 pKa = 10.25PPLTLSSLSMPRR171 pKa = 11.84QQRR174 pKa = 11.84KK175 pKa = 7.1PHH177 pKa = 4.68QQ178 pKa = 3.7
MM1 pKa = 7.13ATALSANLCIVSWTYY16 pKa = 11.13PFLKK20 pKa = 10.11HH21 pKa = 5.96YY22 pKa = 10.81VLGDD26 pKa = 3.5SCRR29 pKa = 11.84AEE31 pKa = 4.13CGLRR35 pKa = 11.84LAKK38 pKa = 10.17ARR40 pKa = 11.84HH41 pKa = 5.69RR42 pKa = 11.84KK43 pKa = 9.59AGLCLEE49 pKa = 4.39YY50 pKa = 10.98ARR52 pKa = 11.84VIASLLNWGVSSALQSCPCQPYY74 pKa = 10.25SRR76 pKa = 11.84SSTCFTLSRR85 pKa = 11.84CMGSSLAFGIKK96 pKa = 9.19IQNPNNLNHH105 pKa = 5.63YY106 pKa = 9.32HH107 pKa = 5.83SPVWLLRR114 pKa = 11.84TKK116 pKa = 10.4PLALRR121 pKa = 11.84QEE123 pKa = 4.03QSLANSLRR131 pKa = 11.84DD132 pKa = 3.45PRR134 pKa = 11.84CPLKK138 pKa = 10.83NKK140 pKa = 9.37PPRR143 pKa = 11.84NIWRR147 pKa = 11.84RR148 pKa = 11.84RR149 pKa = 11.84LMNKK153 pKa = 7.19SQCIIKK159 pKa = 10.25PPLTLSSLSMPRR171 pKa = 11.84QQRR174 pKa = 11.84KK175 pKa = 7.1PHH177 pKa = 4.68QQ178 pKa = 3.7
Molecular weight: 20.2 kDa
Isoelectric point according different methods:
Peptides (in silico digests for buttom-up proteomics)
Below you can find in silico digests of the whole proteome with Trypsin, Chymotrypsin, Trypsin+LysC, LysN, ArgC proteases suitable for different mass spec machines.| Try ESI |
 |
|---|
| ChTry ESI |
 |
|---|
| ArgC ESI |
 |
|---|
| LysN ESI |
 |
|---|
| TryLysC ESI |
 |
|---|
| Try MALDI |
 |
|---|
| ChTry MALDI |
 |
|---|
| ArgC MALDI |
 |
|---|
| LysN MALDI |
 |
|---|
| TryLysC MALDI |
 |
|---|
| Try LTQ |
 |
|---|
| ChTry LTQ |
 |
|---|
| ArgC LTQ |
 |
|---|
| LysN LTQ |
 |
|---|
| TryLysC LTQ |
 |
|---|
| Try MSlow |
 |
|---|
| ChTry MSlow |
 |
|---|
| ArgC MSlow |
 |
|---|
| LysN MSlow |
 |
|---|
| TryLysC MSlow |
 |
|---|
| Try MShigh |
 |
|---|
| ChTry MShigh |
 |
|---|
| ArgC MShigh |
 |
|---|
| LysN MShigh |
 |
|---|
| TryLysC MShigh |
 |
|---|
General Statistics
Number of major isoforms |
Number of additional isoforms |
Number of all proteins |
Number of amino acids |
Min. Seq. Length |
Max. Seq. Length |
Avg. Seq. Length |
Avg. Mol. Weight |
|---|---|---|---|---|---|---|---|
0 |
1362415 |
24 |
7729 |
324.8 |
35.98 |
Amino acid frequency
Ala |
Cys |
Asp |
Glu |
Phe |
Gly |
His |
Ile |
Lys |
Leu |
|---|---|---|---|---|---|---|---|---|---|
9.36 ± 0.05 | 1.078 ± 0.015 |
5.574 ± 0.033 | 5.974 ± 0.043 |
3.997 ± 0.024 | 7.058 ± 0.045 |
2.321 ± 0.02 | 6.424 ± 0.04 |
5.034 ± 0.047 | 10.661 ± 0.053 |
Met |
Asn |
Gln |
Pro |
Arg |
Ser |
Thr |
Val |
Trp |
Tyr |
|---|---|---|---|---|---|---|---|---|---|
2.382 ± 0.023 | 4.07 ± 0.035 |
4.305 ± 0.032 | 4.403 ± 0.028 |
5.051 ± 0.035 | 6.08 ± 0.036 |
5.425 ± 0.058 | 6.639 ± 0.031 |
1.274 ± 0.016 | 2.891 ± 0.019 |
Most of the basic statistics you can see at this page can be downloaded from this CSV file
Proteome-pI is available under Creative Commons Attribution-NoDerivs license, for more details see here
| Reference: Kozlowski LP. Proteome-pI 2.0: Proteome Isoelectric Point Database Update. Nucleic Acids Res. 2021, doi: 10.1093/nar/gkab944 | Contact: Lukasz P. Kozlowski |
