Trichuris trichiura (Whipworm) (Trichocephalus trichiurus)
Taxonomy: cellular organisms; Eukaryota; Opisthokonta; Metazoa; Eumetazoa; Bilateria; Protostomia; Ecdysozoa; Nematoda; Enoplea; Dorylaimia; Trichinellida; Trichuridae; Trichuris
Average proteome isoelectric point is 6.79
Get precalculated fractions of proteins

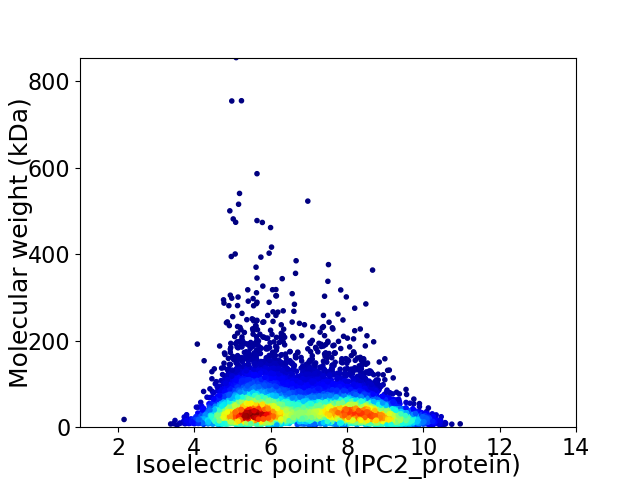
Virtual 2D-PAGE plot for 9625 proteins (isoelectric point calculated using IPC2_protein)
Get csv file with sequences according to given criteria:
* You can choose from 21 different methods for calculating isoelectric point
Summary statistics related to proteome-wise predictions


Protein with the lowest isoelectric point:
>tr|A0A077ZH41|A0A077ZH41_TRITR CSD domain containing protein OS=Trichuris trichiura OX=36087 GN=TTRE_0000731701 PE=4 SV=1
MM1 pKa = 8.07ADD3 pKa = 3.57TDD5 pKa = 4.22LSTNQLLDD13 pKa = 3.46VPLEE17 pKa = 4.02DD18 pKa = 3.55QYY20 pKa = 11.99GGEE23 pKa = 4.03VAMEE27 pKa = 4.18NGCEE31 pKa = 3.73ITALSMLLNYY41 pKa = 10.0YY42 pKa = 10.71GYY44 pKa = 8.86GTDD47 pKa = 3.56KK48 pKa = 11.61NEE50 pKa = 4.85LVDD53 pKa = 5.39LLDD56 pKa = 4.22FVPLYY61 pKa = 10.79EE62 pKa = 4.55DD63 pKa = 3.42AEE65 pKa = 4.34KK66 pKa = 10.49RR67 pKa = 11.84IHH69 pKa = 6.75GNPHH73 pKa = 6.72DD74 pKa = 4.2GFVGNIYY81 pKa = 10.38EE82 pKa = 4.67GYY84 pKa = 9.18EE85 pKa = 3.9AMGVAVEE92 pKa = 5.21PIAEE96 pKa = 4.24VANEE100 pKa = 3.98VVQDD104 pKa = 3.87NQKK107 pKa = 10.01VVANNDD113 pKa = 2.95TSFDD117 pKa = 3.7DD118 pKa = 4.01LVRR121 pKa = 11.84VIQTGTPVWVITTVDD136 pKa = 4.02FQVPTEE142 pKa = 4.12DD143 pKa = 6.16DD144 pKa = 3.37FRR146 pKa = 11.84TWQTTSGEE154 pKa = 4.24IEE156 pKa = 4.31VSPLCHH162 pKa = 6.15AVIITGVDD170 pKa = 3.37EE171 pKa = 4.48EE172 pKa = 4.4NVYY175 pKa = 11.18VNDD178 pKa = 3.87PYY180 pKa = 11.19GYY182 pKa = 10.2KK183 pKa = 10.36NRR185 pKa = 11.84VVDD188 pKa = 3.54RR189 pKa = 11.84TDD191 pKa = 3.38FEE193 pKa = 4.95EE194 pKa = 5.3IYY196 pKa = 10.88QLMGSEE202 pKa = 4.26SLYY205 pKa = 11.31LEE207 pKa = 5.13DD208 pKa = 5.14KK209 pKa = 11.1
MM1 pKa = 8.07ADD3 pKa = 3.57TDD5 pKa = 4.22LSTNQLLDD13 pKa = 3.46VPLEE17 pKa = 4.02DD18 pKa = 3.55QYY20 pKa = 11.99GGEE23 pKa = 4.03VAMEE27 pKa = 4.18NGCEE31 pKa = 3.73ITALSMLLNYY41 pKa = 10.0YY42 pKa = 10.71GYY44 pKa = 8.86GTDD47 pKa = 3.56KK48 pKa = 11.61NEE50 pKa = 4.85LVDD53 pKa = 5.39LLDD56 pKa = 4.22FVPLYY61 pKa = 10.79EE62 pKa = 4.55DD63 pKa = 3.42AEE65 pKa = 4.34KK66 pKa = 10.49RR67 pKa = 11.84IHH69 pKa = 6.75GNPHH73 pKa = 6.72DD74 pKa = 4.2GFVGNIYY81 pKa = 10.38EE82 pKa = 4.67GYY84 pKa = 9.18EE85 pKa = 3.9AMGVAVEE92 pKa = 5.21PIAEE96 pKa = 4.24VANEE100 pKa = 3.98VVQDD104 pKa = 3.87NQKK107 pKa = 10.01VVANNDD113 pKa = 2.95TSFDD117 pKa = 3.7DD118 pKa = 4.01LVRR121 pKa = 11.84VIQTGTPVWVITTVDD136 pKa = 4.02FQVPTEE142 pKa = 4.12DD143 pKa = 6.16DD144 pKa = 3.37FRR146 pKa = 11.84TWQTTSGEE154 pKa = 4.24IEE156 pKa = 4.31VSPLCHH162 pKa = 6.15AVIITGVDD170 pKa = 3.37EE171 pKa = 4.48EE172 pKa = 4.4NVYY175 pKa = 11.18VNDD178 pKa = 3.87PYY180 pKa = 11.19GYY182 pKa = 10.2KK183 pKa = 10.36NRR185 pKa = 11.84VVDD188 pKa = 3.54RR189 pKa = 11.84TDD191 pKa = 3.38FEE193 pKa = 4.95EE194 pKa = 5.3IYY196 pKa = 10.88QLMGSEE202 pKa = 4.26SLYY205 pKa = 11.31LEE207 pKa = 5.13DD208 pKa = 5.14KK209 pKa = 11.1
Molecular weight: 23.45 kDa
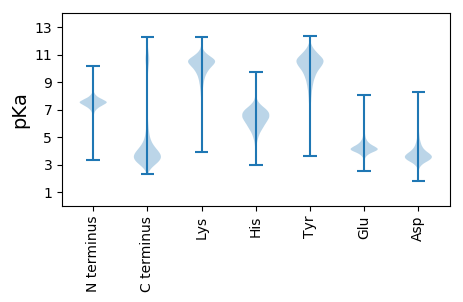
Isoelectric point according different methods:
Protein with the highest isoelectric point:
>tr|A0A077ZKX5|A0A077ZKX5_TRITR CbiA and ParBc and KorB domain containing protein OS=Trichuris trichiura OX=36087 GN=TTRE_0000757601 PE=4 SV=1
MM1 pKa = 6.94QWRR4 pKa = 11.84SVAWRR9 pKa = 11.84GVAWRR14 pKa = 11.84GVAWRR19 pKa = 11.84GGAGSGVAWRR29 pKa = 11.84GVAWGVRR36 pKa = 11.84CGGVGRR42 pKa = 11.84GVAWRR47 pKa = 11.84GGVGRR52 pKa = 11.84GVAWRR57 pKa = 11.84GGVGRR62 pKa = 11.84GVAWRR67 pKa = 11.84GVAWRR72 pKa = 11.84GG73 pKa = 3.16
MM1 pKa = 6.94QWRR4 pKa = 11.84SVAWRR9 pKa = 11.84GVAWRR14 pKa = 11.84GVAWRR19 pKa = 11.84GGAGSGVAWRR29 pKa = 11.84GVAWGVRR36 pKa = 11.84CGGVGRR42 pKa = 11.84GVAWRR47 pKa = 11.84GGVGRR52 pKa = 11.84GVAWRR57 pKa = 11.84GGVGRR62 pKa = 11.84GVAWRR67 pKa = 11.84GVAWRR72 pKa = 11.84GG73 pKa = 3.16
Molecular weight: 7.7 kDa
Isoelectric point according different methods:
Peptides (in silico digests for buttom-up proteomics)
Below you can find in silico digests of the whole proteome with Trypsin, Chymotrypsin, Trypsin+LysC, LysN, ArgC proteases suitable for different mass spec machines.| Try ESI |
 |
|---|
| ChTry ESI |
 |
|---|
| ArgC ESI |
 |
|---|
| LysN ESI |
 |
|---|
| TryLysC ESI |
 |
|---|
| Try MALDI |
 |
|---|
| ChTry MALDI |
 |
|---|
| ArgC MALDI |
 |
|---|
| LysN MALDI |
 |
|---|
| TryLysC MALDI |
 |
|---|
| Try LTQ |
 |
|---|
| ChTry LTQ |
 |
|---|
| ArgC LTQ |
 |
|---|
| LysN LTQ |
 |
|---|
| TryLysC LTQ |
 |
|---|
| Try MSlow |
 |
|---|
| ChTry MSlow |
 |
|---|
| ArgC MSlow |
 |
|---|
| LysN MSlow |
 |
|---|
| TryLysC MSlow |
 |
|---|
| Try MShigh |
 |
|---|
| ChTry MShigh |
 |
|---|
| ArgC MShigh |
 |
|---|
| LysN MShigh |
 |
|---|
| TryLysC MShigh |
 |
|---|
General Statistics
Number of major isoforms |
Number of additional isoforms |
Number of all proteins |
Number of amino acids |
Min. Seq. Length |
Max. Seq. Length |
Avg. Seq. Length |
Avg. Mol. Weight |
|---|---|---|---|---|---|---|---|
0 |
4182167 |
31 |
7532 |
434.5 |
48.85 |
Amino acid frequency
Ala |
Cys |
Asp |
Glu |
Phe |
Gly |
His |
Ile |
Lys |
Leu |
|---|---|---|---|---|---|---|---|---|---|
7.122 ± 0.026 | 2.487 ± 0.024 |
5.258 ± 0.02 | 6.406 ± 0.03 |
4.376 ± 0.017 | 5.766 ± 0.03 |
2.312 ± 0.012 | 5.197 ± 0.019 |
5.675 ± 0.025 | 9.761 ± 0.031 |
Met |
Asn |
Gln |
Pro |
Arg |
Ser |
Thr |
Val |
Trp |
Tyr |
|---|---|---|---|---|---|---|---|---|---|
2.448 ± 0.01 | 4.252 ± 0.014 |
4.699 ± 0.023 | 3.97 ± 0.018 |
5.887 ± 0.018 | 7.934 ± 0.029 |
5.23 ± 0.017 | 6.821 ± 0.018 |
1.233 ± 0.009 | 3.162 ± 0.016 |
Most of the basic statistics you can see at this page can be downloaded from this CSV file
Proteome-pI is available under Creative Commons Attribution-NoDerivs license, for more details see here
| Reference: Kozlowski LP. Proteome-pI 2.0: Proteome Isoelectric Point Database Update. Nucleic Acids Res. 2021, doi: 10.1093/nar/gkab944 | Contact: Lukasz P. Kozlowski |
