Gordonia soli NBRC 108243
Taxonomy: cellular organisms; Bacteria; Terrabacteria group; Actinobacteria; Actinomycetia; Corynebacteriales; Gordoniaceae; Gordonia; Gordonia soli
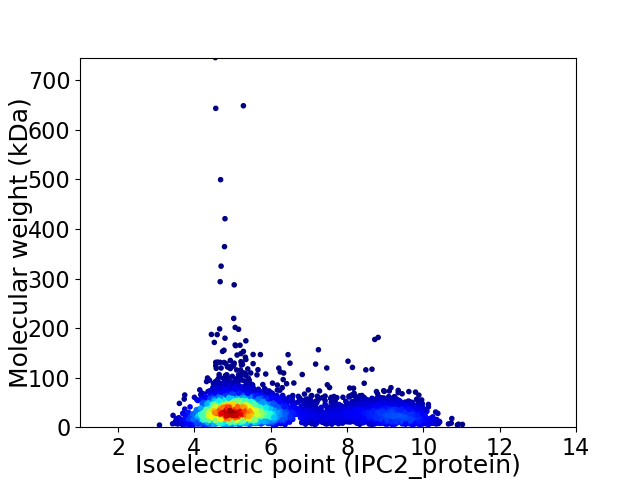
Average proteome isoelectric point is 5.94
Get precalculated fractions of proteins

Virtual 2D-PAGE plot for 4907 proteins (isoelectric point calculated using IPC2_protein)
Get csv file with sequences according to given criteria:
* You can choose from 21 different methods for calculating isoelectric point
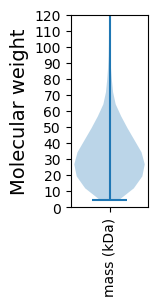
Summary statistics related to proteome-wise predictions


Protein with the lowest isoelectric point:
>tr|M0QIR8|M0QIR8_9ACTN Methionine import ATP-binding protein MetN OS=Gordonia soli NBRC 108243 OX=1223545 GN=metN PE=3 SV=1
MM1 pKa = 7.7TDD3 pKa = 2.96VFDD6 pKa = 5.69GDD8 pKa = 3.92RR9 pKa = 11.84LLQAVDD15 pKa = 3.38VARR18 pKa = 11.84AALIDD23 pKa = 5.07DD24 pKa = 4.75GQQPGAHH31 pKa = 6.83LDD33 pKa = 3.49AGVEE37 pKa = 4.15GDD39 pKa = 3.54WAVAHH44 pKa = 6.03YY45 pKa = 8.73FAADD49 pKa = 3.02IPGYY53 pKa = 10.19RR54 pKa = 11.84GWQWCVVLSGAPGSDD69 pKa = 3.91EE70 pKa = 3.86ITVSEE75 pKa = 4.47VVLLPGEE82 pKa = 4.56GSLLAPTWVPWIEE95 pKa = 3.83RR96 pKa = 11.84VAAGDD101 pKa = 4.2LGPGDD106 pKa = 4.56VLAADD111 pKa = 4.46PDD113 pKa = 4.18DD114 pKa = 3.97VRR116 pKa = 11.84LVPNQIDD123 pKa = 3.91TEE125 pKa = 4.69DD126 pKa = 4.14EE127 pKa = 4.08FHH129 pKa = 7.52LDD131 pKa = 3.94PDD133 pKa = 4.94DD134 pKa = 6.62DD135 pKa = 4.52DD136 pKa = 6.34PEE138 pKa = 7.16DD139 pKa = 3.41IGQIAGEE146 pKa = 4.16LGLGRR151 pKa = 11.84RR152 pKa = 11.84RR153 pKa = 11.84LLSPEE158 pKa = 3.99GRR160 pKa = 11.84DD161 pKa = 3.07EE162 pKa = 4.48AAQRR166 pKa = 11.84WFDD169 pKa = 3.54GDD171 pKa = 4.18FGPASEE177 pKa = 4.5MAQAAPYY184 pKa = 8.37PCCTCGFYY192 pKa = 11.12VPLGGALRR200 pKa = 11.84PAFGACANEE209 pKa = 3.94YY210 pKa = 10.33AADD213 pKa = 3.89GRR215 pKa = 11.84VVAADD220 pKa = 3.87YY221 pKa = 11.38GCGAHH226 pKa = 6.99SDD228 pKa = 3.68VAPPKK233 pKa = 10.45GGEE236 pKa = 3.94GSPAYY241 pKa = 9.91DD242 pKa = 4.15AYY244 pKa = 11.12DD245 pKa = 4.21DD246 pKa = 4.24GAVEE250 pKa = 4.2IVEE253 pKa = 4.29ITPEE257 pKa = 4.13PATVGADD264 pKa = 3.31ADD266 pKa = 4.19GSS268 pKa = 3.93
MM1 pKa = 7.7TDD3 pKa = 2.96VFDD6 pKa = 5.69GDD8 pKa = 3.92RR9 pKa = 11.84LLQAVDD15 pKa = 3.38VARR18 pKa = 11.84AALIDD23 pKa = 5.07DD24 pKa = 4.75GQQPGAHH31 pKa = 6.83LDD33 pKa = 3.49AGVEE37 pKa = 4.15GDD39 pKa = 3.54WAVAHH44 pKa = 6.03YY45 pKa = 8.73FAADD49 pKa = 3.02IPGYY53 pKa = 10.19RR54 pKa = 11.84GWQWCVVLSGAPGSDD69 pKa = 3.91EE70 pKa = 3.86ITVSEE75 pKa = 4.47VVLLPGEE82 pKa = 4.56GSLLAPTWVPWIEE95 pKa = 3.83RR96 pKa = 11.84VAAGDD101 pKa = 4.2LGPGDD106 pKa = 4.56VLAADD111 pKa = 4.46PDD113 pKa = 4.18DD114 pKa = 3.97VRR116 pKa = 11.84LVPNQIDD123 pKa = 3.91TEE125 pKa = 4.69DD126 pKa = 4.14EE127 pKa = 4.08FHH129 pKa = 7.52LDD131 pKa = 3.94PDD133 pKa = 4.94DD134 pKa = 6.62DD135 pKa = 4.52DD136 pKa = 6.34PEE138 pKa = 7.16DD139 pKa = 3.41IGQIAGEE146 pKa = 4.16LGLGRR151 pKa = 11.84RR152 pKa = 11.84RR153 pKa = 11.84LLSPEE158 pKa = 3.99GRR160 pKa = 11.84DD161 pKa = 3.07EE162 pKa = 4.48AAQRR166 pKa = 11.84WFDD169 pKa = 3.54GDD171 pKa = 4.18FGPASEE177 pKa = 4.5MAQAAPYY184 pKa = 8.37PCCTCGFYY192 pKa = 11.12VPLGGALRR200 pKa = 11.84PAFGACANEE209 pKa = 3.94YY210 pKa = 10.33AADD213 pKa = 3.89GRR215 pKa = 11.84VVAADD220 pKa = 3.87YY221 pKa = 11.38GCGAHH226 pKa = 6.99SDD228 pKa = 3.68VAPPKK233 pKa = 10.45GGEE236 pKa = 3.94GSPAYY241 pKa = 9.91DD242 pKa = 4.15AYY244 pKa = 11.12DD245 pKa = 4.21DD246 pKa = 4.24GAVEE250 pKa = 4.2IVEE253 pKa = 4.29ITPEE257 pKa = 4.13PATVGADD264 pKa = 3.31ADD266 pKa = 4.19GSS268 pKa = 3.93
Molecular weight: 27.95 kDa
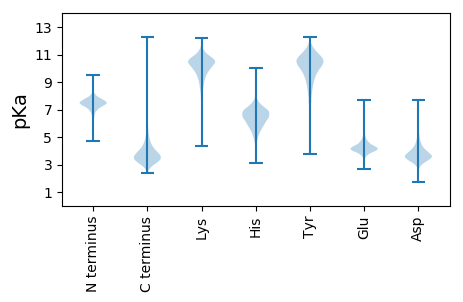
Isoelectric point according different methods:
Protein with the highest isoelectric point:
>tr|M0QH84|M0QH84_9ACTN Putative fatty-acid--CoA ligase OS=Gordonia soli NBRC 108243 OX=1223545 GN=GS4_11_01570 PE=4 SV=1
MM1 pKa = 7.69AKK3 pKa = 10.06GKK5 pKa = 8.69RR6 pKa = 11.84TFQPNNRR13 pKa = 11.84RR14 pKa = 11.84RR15 pKa = 11.84ARR17 pKa = 11.84VHH19 pKa = 5.99GFRR22 pKa = 11.84LRR24 pKa = 11.84MRR26 pKa = 11.84TRR28 pKa = 11.84AGRR31 pKa = 11.84AIVNGRR37 pKa = 11.84RR38 pKa = 11.84RR39 pKa = 11.84KK40 pKa = 10.03GRR42 pKa = 11.84EE43 pKa = 3.54KK44 pKa = 10.3LTAA47 pKa = 4.1
MM1 pKa = 7.69AKK3 pKa = 10.06GKK5 pKa = 8.69RR6 pKa = 11.84TFQPNNRR13 pKa = 11.84RR14 pKa = 11.84RR15 pKa = 11.84ARR17 pKa = 11.84VHH19 pKa = 5.99GFRR22 pKa = 11.84LRR24 pKa = 11.84MRR26 pKa = 11.84TRR28 pKa = 11.84AGRR31 pKa = 11.84AIVNGRR37 pKa = 11.84RR38 pKa = 11.84RR39 pKa = 11.84KK40 pKa = 10.03GRR42 pKa = 11.84EE43 pKa = 3.54KK44 pKa = 10.3LTAA47 pKa = 4.1
Molecular weight: 5.59 kDa
Isoelectric point according different methods:
Peptides (in silico digests for buttom-up proteomics)
Below you can find in silico digests of the whole proteome with Trypsin, Chymotrypsin, Trypsin+LysC, LysN, ArgC proteases suitable for different mass spec machines.| Try ESI |
 |
|---|
| ChTry ESI |
 |
|---|
| ArgC ESI |
 |
|---|
| LysN ESI |
 |
|---|
| TryLysC ESI |
 |
|---|
| Try MALDI |
 |
|---|
| ChTry MALDI |
 |
|---|
| ArgC MALDI |
 |
|---|
| LysN MALDI |
 |
|---|
| TryLysC MALDI |
 |
|---|
| Try LTQ |
 |
|---|
| ChTry LTQ |
 |
|---|
| ArgC LTQ |
 |
|---|
| LysN LTQ |
 |
|---|
| TryLysC LTQ |
 |
|---|
| Try MSlow |
 |
|---|
| ChTry MSlow |
 |
|---|
| ArgC MSlow |
 |
|---|
| LysN MSlow |
 |
|---|
| TryLysC MSlow |
 |
|---|
| Try MShigh |
 |
|---|
| ChTry MShigh |
 |
|---|
| ArgC MShigh |
 |
|---|
| LysN MShigh |
 |
|---|
| TryLysC MShigh |
 |
|---|
General Statistics
Number of major isoforms |
Number of additional isoforms |
Number of all proteins |
Number of amino acids |
Min. Seq. Length |
Max. Seq. Length |
Avg. Seq. Length |
Avg. Mol. Weight |
|---|---|---|---|---|---|---|---|
0 |
1606877 |
40 |
7062 |
327.5 |
35.03 |
Amino acid frequency
Ala |
Cys |
Asp |
Glu |
Phe |
Gly |
His |
Ile |
Lys |
Leu |
|---|---|---|---|---|---|---|---|---|---|
12.833 ± 0.043 | 0.646 ± 0.01 |
6.933 ± 0.034 | 5.151 ± 0.031 |
2.93 ± 0.019 | 9.08 ± 0.034 |
2.152 ± 0.016 | 4.52 ± 0.024 |
1.874 ± 0.028 | 9.389 ± 0.035 |
Met |
Asn |
Gln |
Pro |
Arg |
Ser |
Thr |
Val |
Trp |
Tyr |
|---|---|---|---|---|---|---|---|---|---|
1.811 ± 0.014 | 1.966 ± 0.021 |
5.648 ± 0.026 | 2.67 ± 0.018 |
7.601 ± 0.036 | 5.874 ± 0.026 |
6.465 ± 0.023 | 9.058 ± 0.036 |
1.442 ± 0.013 | 1.958 ± 0.016 |
Most of the basic statistics you can see at this page can be downloaded from this CSV file
Proteome-pI is available under Creative Commons Attribution-NoDerivs license, for more details see here
| Reference: Kozlowski LP. Proteome-pI 2.0: Proteome Isoelectric Point Database Update. Nucleic Acids Res. 2021, doi: 10.1093/nar/gkab944 | Contact: Lukasz P. Kozlowski |
