Ostreococcus tauri virus RT-2011
Taxonomy: Viruses; Varidnaviria; Bamfordvirae; Nucleocytoviricota; Megaviricetes; Algavirales; Phycodnaviridae; Prasinovirus; unclassified Prasinovirus
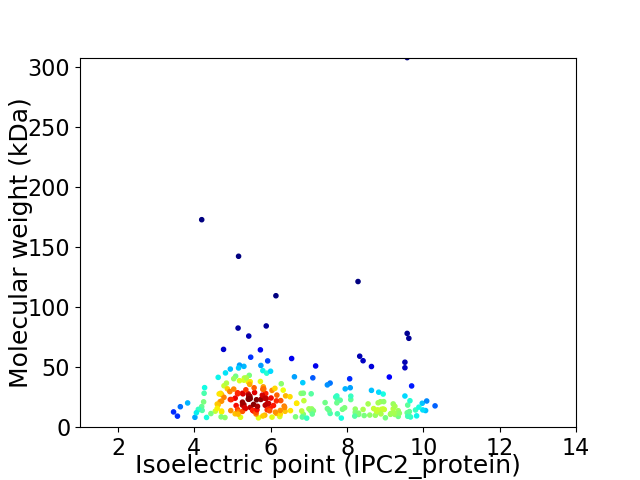
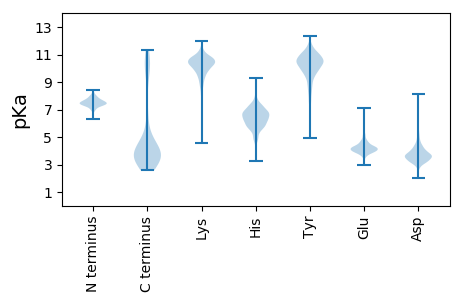
Average proteome isoelectric point is 6.54
Get precalculated fractions of proteins

Virtual 2D-PAGE plot for 249 proteins (isoelectric point calculated using IPC2_protein)
Get csv file with sequences according to given criteria:
* You can choose from 21 different methods for calculating isoelectric point
Summary statistics related to proteome-wise predictions


Protein with the lowest isoelectric point:
>tr|H8ZJ96|H8ZJ96_9PHYC Uncharacterized protein OS=Ostreococcus tauri virus RT-2011 OX=1120767 GN=OtV6_099c PE=4 SV=1
MM1 pKa = 7.57NMQTGFGDD9 pKa = 3.67AGDD12 pKa = 4.36GMLEE16 pKa = 3.93QYY18 pKa = 7.96MKK20 pKa = 11.48SMIDD24 pKa = 3.51IIQPVMEE31 pKa = 4.66KK32 pKa = 11.14AMILAAEE39 pKa = 4.16YY40 pKa = 11.0SKK42 pKa = 11.65ACGRR46 pKa = 11.84DD47 pKa = 3.3TILPEE52 pKa = 4.25DD53 pKa = 3.66MEE55 pKa = 4.66YY56 pKa = 11.51AMKK59 pKa = 10.01YY60 pKa = 10.02CAMNTVGEE68 pKa = 4.53TIGSIMPEE76 pKa = 3.75IYY78 pKa = 10.39DD79 pKa = 4.18EE80 pKa = 4.32EE81 pKa = 5.69LSDD84 pKa = 3.76EE85 pKa = 4.47DD86 pKa = 4.82EE87 pKa = 4.38EE88 pKa = 5.57LEE90 pKa = 4.64EE91 pKa = 5.76IDD93 pKa = 6.13PEE95 pKa = 4.38DD96 pKa = 4.47CPDD99 pKa = 3.85FVRR102 pKa = 11.84YY103 pKa = 10.24SGTDD107 pKa = 3.13PNFIMVNEE115 pKa = 4.23AVDD118 pKa = 4.23RR119 pKa = 11.84WDD121 pKa = 2.99NWVPQNPTEE130 pKa = 4.27QMLKK134 pKa = 10.46NAINSNEE141 pKa = 3.97YY142 pKa = 10.01IGAGGVDD149 pKa = 4.0DD150 pKa = 4.86FF151 pKa = 5.83
MM1 pKa = 7.57NMQTGFGDD9 pKa = 3.67AGDD12 pKa = 4.36GMLEE16 pKa = 3.93QYY18 pKa = 7.96MKK20 pKa = 11.48SMIDD24 pKa = 3.51IIQPVMEE31 pKa = 4.66KK32 pKa = 11.14AMILAAEE39 pKa = 4.16YY40 pKa = 11.0SKK42 pKa = 11.65ACGRR46 pKa = 11.84DD47 pKa = 3.3TILPEE52 pKa = 4.25DD53 pKa = 3.66MEE55 pKa = 4.66YY56 pKa = 11.51AMKK59 pKa = 10.01YY60 pKa = 10.02CAMNTVGEE68 pKa = 4.53TIGSIMPEE76 pKa = 3.75IYY78 pKa = 10.39DD79 pKa = 4.18EE80 pKa = 4.32EE81 pKa = 5.69LSDD84 pKa = 3.76EE85 pKa = 4.47DD86 pKa = 4.82EE87 pKa = 4.38EE88 pKa = 5.57LEE90 pKa = 4.64EE91 pKa = 5.76IDD93 pKa = 6.13PEE95 pKa = 4.38DD96 pKa = 4.47CPDD99 pKa = 3.85FVRR102 pKa = 11.84YY103 pKa = 10.24SGTDD107 pKa = 3.13PNFIMVNEE115 pKa = 4.23AVDD118 pKa = 4.23RR119 pKa = 11.84WDD121 pKa = 2.99NWVPQNPTEE130 pKa = 4.27QMLKK134 pKa = 10.46NAINSNEE141 pKa = 3.97YY142 pKa = 10.01IGAGGVDD149 pKa = 4.0DD150 pKa = 4.86FF151 pKa = 5.83
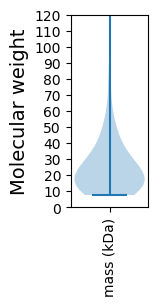
Molecular weight: 17.05 kDa
Isoelectric point according different methods:
Protein with the highest isoelectric point:
>tr|H8ZJC0|H8ZJC0_9PHYC Uncharacterized protein OS=Ostreococcus tauri virus RT-2011 OX=1120767 GN=OtV6_123c PE=4 SV=1
MM1 pKa = 7.43LPDD4 pKa = 3.11ITSQKK9 pKa = 9.25VAVPAALFLALSPGVLLTTNGQKK32 pKa = 10.52LAFRR36 pKa = 11.84NGKK39 pKa = 6.49TNQMAVFFHH48 pKa = 6.73ALVFFLVYY56 pKa = 10.7SLIARR61 pKa = 11.84AMGLVLTKK69 pKa = 10.17TDD71 pKa = 4.99LIVTTVLFLALSPGLLLTLPPGSGGVLRR99 pKa = 11.84SGQTSIPAAVTHH111 pKa = 6.06AVVFAVVFALLRR123 pKa = 11.84KK124 pKa = 9.18QFPQFYY130 pKa = 10.47
MM1 pKa = 7.43LPDD4 pKa = 3.11ITSQKK9 pKa = 9.25VAVPAALFLALSPGVLLTTNGQKK32 pKa = 10.52LAFRR36 pKa = 11.84NGKK39 pKa = 6.49TNQMAVFFHH48 pKa = 6.73ALVFFLVYY56 pKa = 10.7SLIARR61 pKa = 11.84AMGLVLTKK69 pKa = 10.17TDD71 pKa = 4.99LIVTTVLFLALSPGLLLTLPPGSGGVLRR99 pKa = 11.84SGQTSIPAAVTHH111 pKa = 6.06AVVFAVVFALLRR123 pKa = 11.84KK124 pKa = 9.18QFPQFYY130 pKa = 10.47
Molecular weight: 13.86 kDa
Isoelectric point according different methods:
Peptides (in silico digests for buttom-up proteomics)
Below you can find in silico digests of the whole proteome with Trypsin, Chymotrypsin, Trypsin+LysC, LysN, ArgC proteases suitable for different mass spec machines.| Try ESI |
 |
|---|
| ChTry ESI |
 |
|---|
| ArgC ESI |
 |
|---|
| LysN ESI |
 |
|---|
| TryLysC ESI |
 |
|---|
| Try MALDI |
 |
|---|
| ChTry MALDI |
 |
|---|
| ArgC MALDI |
 |
|---|
| LysN MALDI |
 |
|---|
| TryLysC MALDI |
 |
|---|
| Try LTQ |
 |
|---|
| ChTry LTQ |
 |
|---|
| ArgC LTQ |
 |
|---|
| LysN LTQ |
 |
|---|
| TryLysC LTQ |
 |
|---|
| Try MSlow |
 |
|---|
| ChTry MSlow |
 |
|---|
| ArgC MSlow |
 |
|---|
| LysN MSlow |
 |
|---|
| TryLysC MSlow |
 |
|---|
| Try MShigh |
 |
|---|
| ChTry MShigh |
 |
|---|
| ArgC MShigh |
 |
|---|
| LysN MShigh |
 |
|---|
| TryLysC MShigh |
 |
|---|
General Statistics
Number of major isoforms |
Number of additional isoforms |
Number of all proteins |
Number of amino acids |
Min. Seq. Length |
Max. Seq. Length |
Avg. Seq. Length |
Avg. Mol. Weight |
|---|---|---|---|---|---|---|---|
0 |
59376 |
66 |
2671 |
238.5 |
27.15 |
Amino acid frequency
Ala |
Cys |
Asp |
Glu |
Phe |
Gly |
His |
Ile |
Lys |
Leu |
|---|---|---|---|---|---|---|---|---|---|
5.497 ± 0.199 | 1.679 ± 0.134 |
6.061 ± 0.167 | 6.683 ± 0.195 |
4.362 ± 0.157 | 5.945 ± 0.223 |
2.141 ± 0.125 | 6.327 ± 0.178 |
7.963 ± 0.41 | 8.182 ± 0.179 |
Met |
Asn |
Gln |
Pro |
Arg |
Ser |
Thr |
Val |
Trp |
Tyr |
|---|---|---|---|---|---|---|---|---|---|
3.015 ± 0.103 | 5.822 ± 0.352 |
4.177 ± 0.179 | 3.276 ± 0.139 |
4.909 ± 0.249 | 6.026 ± 0.19 |
6.135 ± 0.222 | 6.733 ± 0.204 |
1.056 ± 0.063 | 4.01 ± 0.164 |
Most of the basic statistics you can see at this page can be downloaded from this CSV file
Proteome-pI is available under Creative Commons Attribution-NoDerivs license, for more details see here
| Reference: Kozlowski LP. Proteome-pI 2.0: Proteome Isoelectric Point Database Update. Nucleic Acids Res. 2021, doi: 10.1093/nar/gkab944 | Contact: Lukasz P. Kozlowski |
