Mycobacterium phage JF4
Taxonomy: Viruses; Duplodnaviria; Heunggongvirae; Uroviricota; Caudoviricetes; Caudovirales; Siphoviridae; Fromanvirus; unclassified Fromanvirus
Average proteome isoelectric point is 6.22
Get precalculated fractions of proteins
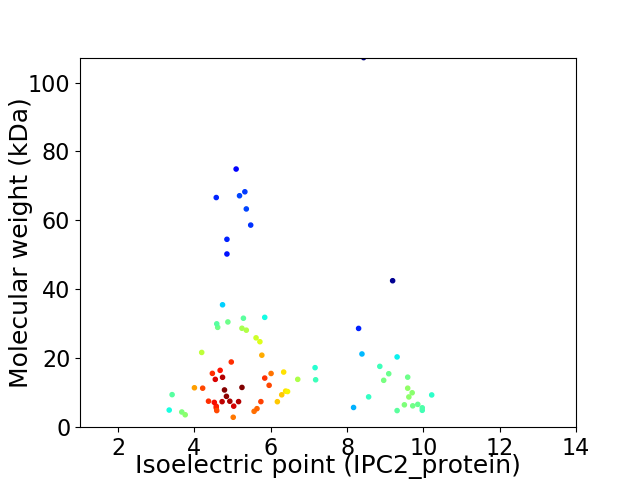
Virtual 2D-PAGE plot for 79 proteins (isoelectric point calculated using IPC2_protein)
Get csv file with sequences according to given criteria:
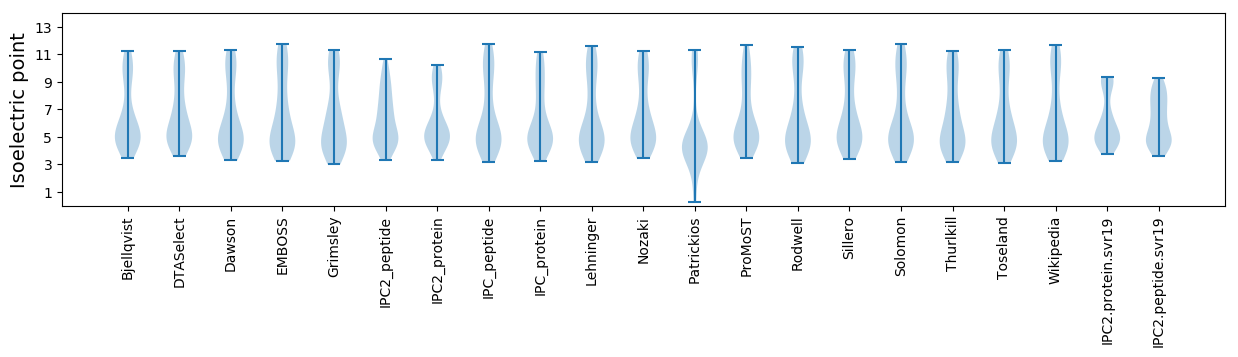
* You can choose from 21 different methods for calculating isoelectric point
Summary statistics related to proteome-wise predictions
Protein with the lowest isoelectric point:
>tr|A0A6M3T1T0|A0A6M3T1T0_9CAUD Uncharacterized protein OS=Mycobacterium phage JF4 OX=2725641 GN=73 PE=4 SV=1
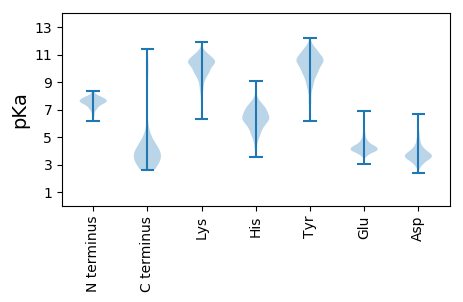
MM1 pKa = 7.61TLPKK5 pKa = 10.51NLTSHH10 pKa = 6.41SDD12 pKa = 3.43EE13 pKa = 4.39VDD15 pKa = 2.53WDD17 pKa = 3.8AVHH20 pKa = 7.46DD21 pKa = 4.09YY22 pKa = 10.92VYY24 pKa = 10.98EE25 pKa = 5.18GDD27 pKa = 4.83DD28 pKa = 4.06DD29 pKa = 4.96NEE31 pKa = 4.05
MM1 pKa = 7.61TLPKK5 pKa = 10.51NLTSHH10 pKa = 6.41SDD12 pKa = 3.43EE13 pKa = 4.39VDD15 pKa = 2.53WDD17 pKa = 3.8AVHH20 pKa = 7.46DD21 pKa = 4.09YY22 pKa = 10.92VYY24 pKa = 10.98EE25 pKa = 5.18GDD27 pKa = 4.83DD28 pKa = 4.06DD29 pKa = 4.96NEE31 pKa = 4.05
Molecular weight: 3.61 kDa
Isoelectric point according different methods:
Protein with the highest isoelectric point:
>tr|A0A6M3T3N5|A0A6M3T3N5_9CAUD Helix-turn-helix DNA binding domain protein OS=Mycobacterium phage JF4 OX=2725641 GN=46 PE=4 SV=1
MM1 pKa = 7.25MIVARR6 pKa = 11.84RR7 pKa = 11.84RR8 pKa = 11.84VALGVASAGTVAVGGLAFALSFTALRR34 pKa = 11.84DD35 pKa = 3.56LSASNGVAQAWMVPLVVDD53 pKa = 3.79GGIIVATAATVALRR67 pKa = 11.84RR68 pKa = 11.84HH69 pKa = 5.22QWYY72 pKa = 9.42AWTLLILSSLVSVAGNVAHH91 pKa = 6.57AQAHH95 pKa = 5.49GAIAMVIAAIPPLWLLAATHH115 pKa = 5.73LTVMLSRR122 pKa = 11.84SDD124 pKa = 3.85KK125 pKa = 10.87EE126 pKa = 4.24PVPVAAEE133 pKa = 3.9PLHH136 pKa = 6.32IANAAA141 pKa = 3.29
MM1 pKa = 7.25MIVARR6 pKa = 11.84RR7 pKa = 11.84RR8 pKa = 11.84VALGVASAGTVAVGGLAFALSFTALRR34 pKa = 11.84DD35 pKa = 3.56LSASNGVAQAWMVPLVVDD53 pKa = 3.79GGIIVATAATVALRR67 pKa = 11.84RR68 pKa = 11.84HH69 pKa = 5.22QWYY72 pKa = 9.42AWTLLILSSLVSVAGNVAHH91 pKa = 6.57AQAHH95 pKa = 5.49GAIAMVIAAIPPLWLLAATHH115 pKa = 5.73LTVMLSRR122 pKa = 11.84SDD124 pKa = 3.85KK125 pKa = 10.87EE126 pKa = 4.24PVPVAAEE133 pKa = 3.9PLHH136 pKa = 6.32IANAAA141 pKa = 3.29
Molecular weight: 14.52 kDa
Isoelectric point according different methods:
Peptides (in silico digests for buttom-up proteomics)
Below you can find in silico digests of the whole proteome with Trypsin, Chymotrypsin, Trypsin+LysC, LysN, ArgC proteases suitable for different mass spec machines.| Try ESI |
 |
|---|
| ChTry ESI |
|
|---|
| ArgC ESI |
|
|---|
| LysN ESI |
|
|---|
| TryLysC ESI |
|
|---|
| Try MALDI |
|
|---|
| ChTry MALDI |
|
|---|
| ArgC MALDI |
|
|---|
| LysN MALDI |
|
|---|
| TryLysC MALDI |
|
|---|
| Try LTQ |
|
|---|
| ChTry LTQ |
|
|---|
| ArgC LTQ |
|
|---|
| LysN LTQ |
|
|---|
| TryLysC LTQ |
|
|---|
| Try MSlow |
|
|---|
| ChTry MSlow |
|
|---|
| ArgC MSlow |
|
|---|
| LysN MSlow |
|
|---|
| TryLysC MSlow |
|
|---|
| Try MShigh |
|
|---|
| ChTry MShigh |
|
|---|
| ArgC MShigh |
|
|---|
| LysN MShigh |
|
|---|
| TryLysC MShigh |
|
|---|
General Statistics
Number of major isoforms |
Number of additional isoforms |
Number of all proteins |
Number of amino acids |
Min. Seq. Length |
Max. Seq. Length |
Avg. Seq. Length |
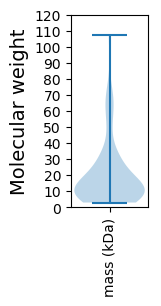
Avg. Mol. Weight |
|---|---|---|---|---|---|---|---|
0 |
14331 |
27 |
1014 |
181.4 |
20.11 |
Amino acid frequency
Ala |
Cys |
Asp |
Glu |
Phe |
Gly |
His |
Ile |
Lys |
Leu |
|---|---|---|---|---|---|---|---|---|---|
9.664 ± 0.379 | 0.809 ± 0.113 |
6.315 ± 0.267 | 6.887 ± 0.307 |
3.308 ± 0.216 | 8.185 ± 0.434 |
2.128 ± 0.2 | 4.668 ± 0.166 |
4.284 ± 0.226 | 8.213 ± 0.308 |
Met |
Asn |
Gln |
Pro |
Arg |
Ser |
Thr |
Val |
Trp |
Tyr |
|---|---|---|---|---|---|---|---|---|---|
2.456 ± 0.154 | 3.538 ± 0.211 |
5.792 ± 0.341 | 3.817 ± 0.33 |
6.866 ± 0.358 | 5.185 ± 0.217 |
5.652 ± 0.222 | 7.424 ± 0.241 |
1.947 ± 0.128 | 2.861 ± 0.208 |
Most of the basic statistics you can see at this page can be downloaded from this CSV file
See this proteome in:

Proteome-pI is available under Creative Commons Attribution-NoDerivs license, for more details see here
| Reference: Kozlowski LP. Proteome-pI 2.0: Proteome Isoelectric Point Database Update. Nucleic Acids Res. 2021, doi: 10.1093/nar/gkab944 | Contact: Lukasz P. Kozlowski |