Potato virus M (strain Russian) (PVM)
Taxonomy: Viruses; Riboviria; Orthornavirae; Kitrinoviricota; Alsuviricetes; Tymovirales; Betaflexiviridae; Quinvirinae; Carlavirus; Potato virus M
Average proteome isoelectric point is 7.37
Get precalculated fractions of proteins

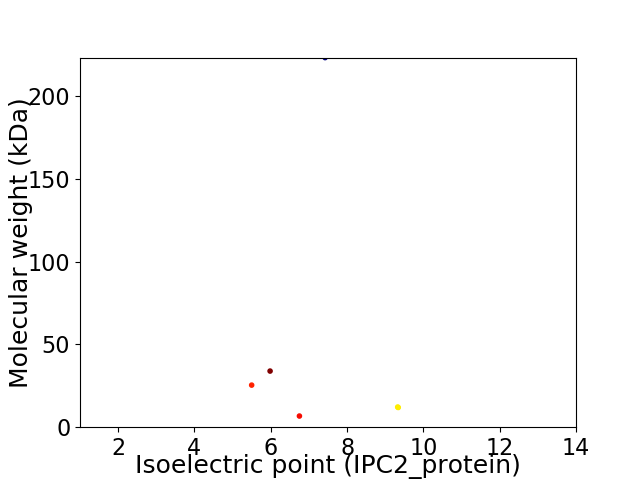
Virtual 2D-PAGE plot for 6 proteins (isoelectric point calculated using IPC2_protein)
Get csv file with sequences according to given criteria:
* You can choose from 21 different methods for calculating isoelectric point
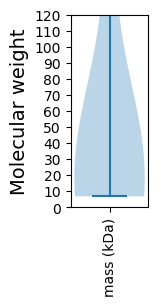
Summary statistics related to proteome-wise predictions


Protein with the lowest isoelectric point:
>sp|P17527|TGB2_PVMR Movement protein TGB2 OS=Potato virus M (strain Russian) OX=12168 GN=ORF3 PE=3 SV=1
MM1 pKa = 7.76DD2 pKa = 5.11VIVDD6 pKa = 4.1LLYY9 pKa = 10.26KK10 pKa = 10.66YY11 pKa = 10.62KK12 pKa = 10.7FEE14 pKa = 4.34RR15 pKa = 11.84LSNKK19 pKa = 8.88LVCPIVVHH27 pKa = 6.06CVPGAGKK34 pKa = 10.35SSLIRR39 pKa = 11.84EE40 pKa = 4.27LLEE43 pKa = 4.18LDD45 pKa = 4.3SRR47 pKa = 11.84FCAYY51 pKa = 8.73TAGVEE56 pKa = 4.09DD57 pKa = 4.13QPRR60 pKa = 11.84LSGNWIRR67 pKa = 11.84KK68 pKa = 7.95WSGQQPEE75 pKa = 4.58GKK77 pKa = 9.81FVVLDD82 pKa = 4.25EE83 pKa = 4.36YY84 pKa = 11.4TLLTEE89 pKa = 4.27VPPVFALFGDD99 pKa = 5.26PIQSNTSAVQRR110 pKa = 11.84ADD112 pKa = 3.85FVCSVSRR119 pKa = 11.84RR120 pKa = 11.84FGSATCGLLRR130 pKa = 11.84EE131 pKa = 4.65LGWNVRR137 pKa = 11.84SEE139 pKa = 4.22KK140 pKa = 10.75ADD142 pKa = 3.55LVQVSDD148 pKa = 4.91IYY150 pKa = 11.39TKK152 pKa = 10.99DD153 pKa = 3.38PLGKK157 pKa = 10.0VVFSEE162 pKa = 4.54EE163 pKa = 4.04EE164 pKa = 4.13VGCLLRR170 pKa = 11.84SHH172 pKa = 6.31GVEE175 pKa = 3.52ALSLQEE181 pKa = 3.62ITGQTFEE188 pKa = 4.22VVTFVTSEE196 pKa = 3.72NSPVINRR203 pKa = 11.84AAAYY207 pKa = 10.1QCMTRR212 pKa = 11.84HH213 pKa = 5.07RR214 pKa = 11.84TALHH218 pKa = 6.25ILCPDD223 pKa = 3.34ATYY226 pKa = 9.14TAAA229 pKa = 4.96
MM1 pKa = 7.76DD2 pKa = 5.11VIVDD6 pKa = 4.1LLYY9 pKa = 10.26KK10 pKa = 10.66YY11 pKa = 10.62KK12 pKa = 10.7FEE14 pKa = 4.34RR15 pKa = 11.84LSNKK19 pKa = 8.88LVCPIVVHH27 pKa = 6.06CVPGAGKK34 pKa = 10.35SSLIRR39 pKa = 11.84EE40 pKa = 4.27LLEE43 pKa = 4.18LDD45 pKa = 4.3SRR47 pKa = 11.84FCAYY51 pKa = 8.73TAGVEE56 pKa = 4.09DD57 pKa = 4.13QPRR60 pKa = 11.84LSGNWIRR67 pKa = 11.84KK68 pKa = 7.95WSGQQPEE75 pKa = 4.58GKK77 pKa = 9.81FVVLDD82 pKa = 4.25EE83 pKa = 4.36YY84 pKa = 11.4TLLTEE89 pKa = 4.27VPPVFALFGDD99 pKa = 5.26PIQSNTSAVQRR110 pKa = 11.84ADD112 pKa = 3.85FVCSVSRR119 pKa = 11.84RR120 pKa = 11.84FGSATCGLLRR130 pKa = 11.84EE131 pKa = 4.65LGWNVRR137 pKa = 11.84SEE139 pKa = 4.22KK140 pKa = 10.75ADD142 pKa = 3.55LVQVSDD148 pKa = 4.91IYY150 pKa = 11.39TKK152 pKa = 10.99DD153 pKa = 3.38PLGKK157 pKa = 10.0VVFSEE162 pKa = 4.54EE163 pKa = 4.04EE164 pKa = 4.13VGCLLRR170 pKa = 11.84SHH172 pKa = 6.31GVEE175 pKa = 3.52ALSLQEE181 pKa = 3.62ITGQTFEE188 pKa = 4.22VVTFVTSEE196 pKa = 3.72NSPVINRR203 pKa = 11.84AAAYY207 pKa = 10.1QCMTRR212 pKa = 11.84HH213 pKa = 5.07RR214 pKa = 11.84TALHH218 pKa = 6.25ILCPDD223 pKa = 3.34ATYY226 pKa = 9.14TAAA229 pKa = 4.96
Molecular weight: 25.44 kDa
Isoelectric point according different methods:
Protein with the highest isoelectric point:
>sp|P17965|RDRP_PVMR RNA replication polyprotein OS=Potato virus M (strain Russian) OX=12168 GN=ORF1 PE=3 SV=2
MM1 pKa = 7.83KK2 pKa = 10.35DD3 pKa = 3.23VTKK6 pKa = 10.78VALLIARR13 pKa = 11.84AMCASSGTFVFEE25 pKa = 4.09LAFSITEE32 pKa = 3.86YY33 pKa = 10.13TGRR36 pKa = 11.84PLGGGRR42 pKa = 11.84SKK44 pKa = 10.49YY45 pKa = 10.1ARR47 pKa = 11.84RR48 pKa = 11.84RR49 pKa = 11.84RR50 pKa = 11.84AISIARR56 pKa = 11.84CHH58 pKa = 5.64RR59 pKa = 11.84CYY61 pKa = 10.6RR62 pKa = 11.84LWPPTVFTTRR72 pKa = 11.84CDD74 pKa = 3.61NKK76 pKa = 10.2HH77 pKa = 5.87CVPGISYY84 pKa = 10.14NVRR87 pKa = 11.84VAQFIDD93 pKa = 3.44EE94 pKa = 4.6GVTEE98 pKa = 4.82VIPSVINKK106 pKa = 9.72RR107 pKa = 11.84EE108 pKa = 3.77
MM1 pKa = 7.83KK2 pKa = 10.35DD3 pKa = 3.23VTKK6 pKa = 10.78VALLIARR13 pKa = 11.84AMCASSGTFVFEE25 pKa = 4.09LAFSITEE32 pKa = 3.86YY33 pKa = 10.13TGRR36 pKa = 11.84PLGGGRR42 pKa = 11.84SKK44 pKa = 10.49YY45 pKa = 10.1ARR47 pKa = 11.84RR48 pKa = 11.84RR49 pKa = 11.84RR50 pKa = 11.84AISIARR56 pKa = 11.84CHH58 pKa = 5.64RR59 pKa = 11.84CYY61 pKa = 10.6RR62 pKa = 11.84LWPPTVFTTRR72 pKa = 11.84CDD74 pKa = 3.61NKK76 pKa = 10.2HH77 pKa = 5.87CVPGISYY84 pKa = 10.14NVRR87 pKa = 11.84VAQFIDD93 pKa = 3.44EE94 pKa = 4.6GVTEE98 pKa = 4.82VIPSVINKK106 pKa = 9.72RR107 pKa = 11.84EE108 pKa = 3.77
Molecular weight: 12.18 kDa
Isoelectric point according different methods:
Peptides (in silico digests for buttom-up proteomics)
Below you can find in silico digests of the whole proteome with Trypsin, Chymotrypsin, Trypsin+LysC, LysN, ArgC proteases suitable for different mass spec machines.| Try ESI |
 |
|---|
| ChTry ESI |
 |
|---|
| ArgC ESI |
 |
|---|
| LysN ESI |
 |
|---|
| TryLysC ESI |
 |
|---|
| Try MALDI |
 |
|---|
| ChTry MALDI |
 |
|---|
| ArgC MALDI |
 |
|---|
| LysN MALDI |
 |
|---|
| TryLysC MALDI |
 |
|---|
| Try LTQ |
 |
|---|
| ChTry LTQ |
 |
|---|
| ArgC LTQ |
 |
|---|
| LysN LTQ |
 |
|---|
| TryLysC LTQ |
 |
|---|
| Try MSlow |
 |
|---|
| ChTry MSlow |
 |
|---|
| ArgC MSlow |
 |
|---|
| LysN MSlow |
 |
|---|
| TryLysC MSlow |
 |
|---|
| Try MShigh |
 |
|---|
| ChTry MShigh |
 |
|---|
| ArgC MShigh |
 |
|---|
| LysN MShigh |
 |
|---|
| TryLysC MShigh |
 |
|---|
General Statistics
Number of major isoforms |
Number of additional isoforms |
Number of all proteins |
Number of amino acids |
Min. Seq. Length |
Max. Seq. Length |
Avg. Seq. Length |
Avg. Mol. Weight |
|---|---|---|---|---|---|---|---|
0 |
2781 |
63 |
1968 |
463.5 |
52.27 |
Amino acid frequency
Ala |
Cys |
Asp |
Glu |
Phe |
Gly |
His |
Ile |
Lys |
Leu |
|---|---|---|---|---|---|---|---|---|---|
7.983 ± 0.672 | 2.769 ± 0.501 |
4.495 ± 0.434 | 6.976 ± 0.993 |
4.746 ± 0.556 | 6.472 ± 0.536 |
2.445 ± 0.353 | 3.955 ± 0.551 |
5.502 ± 0.805 | 9.853 ± 0.736 |
Met |
Asn |
Gln |
Pro |
Arg |
Ser |
Thr |
Val |
Trp |
Tyr |
|---|---|---|---|---|---|---|---|---|---|
2.805 ± 0.642 | 4.279 ± 0.649 |
4.063 ± 0.899 | 2.661 ± 0.292 |
6.94 ± 0.697 | 6.544 ± 0.611 |
4.423 ± 0.766 | 8.306 ± 0.87 |
1.474 ± 0.259 | 3.308 ± 0.313 |
Most of the basic statistics you can see at this page can be downloaded from this CSV file
Proteome-pI is available under Creative Commons Attribution-NoDerivs license, for more details see here
| Reference: Kozlowski LP. Proteome-pI 2.0: Proteome Isoelectric Point Database Update. Nucleic Acids Res. 2021, doi: 10.1093/nar/gkab944 | Contact: Lukasz P. Kozlowski |
