Rice stripe virus (isolate T) (RSV)
Taxonomy: Viruses; Riboviria; Orthornavirae; Negarnaviricota; Polyploviricotina; Ellioviricetes; Bunyavirales; Phenuiviridae; Tenuivirus; Rice stripe tenuivirus
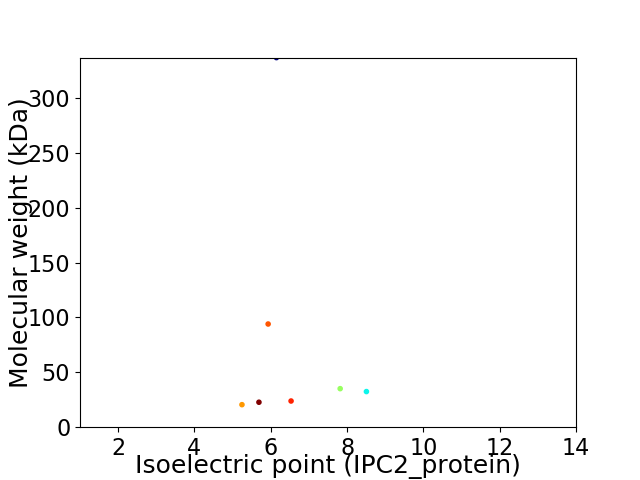
Average proteome isoelectric point is 6.48
Get precalculated fractions of proteins

Virtual 2D-PAGE plot for 7 proteins (isoelectric point calculated using IPC2_protein)
Get csv file with sequences according to given criteria:
* You can choose from 21 different methods for calculating isoelectric point
Summary statistics related to proteome-wise predictions


Protein with the lowest isoelectric point:
>sp|Q00847|MVP_RSVT Movement protein OS=Rice stripe virus (isolate T) OX=36394 GN=pc4 PE=1 SV=1
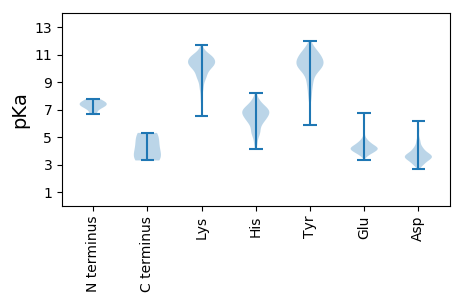
MM1 pKa = 7.46QDD3 pKa = 2.94VQRR6 pKa = 11.84TIEE9 pKa = 4.12VSVGPIVGLDD19 pKa = 3.21YY20 pKa = 11.19TLLYY24 pKa = 8.88DD25 pKa = 4.16TLPEE29 pKa = 4.2TVSDD33 pKa = 4.77NITLPDD39 pKa = 3.69LKK41 pKa = 10.92DD42 pKa = 3.57PEE44 pKa = 4.69RR45 pKa = 11.84VTEE48 pKa = 4.05DD49 pKa = 3.08TKK51 pKa = 11.68KK52 pKa = 10.9LILKK56 pKa = 8.1GCVYY60 pKa = 10.44IAYY63 pKa = 8.74HH64 pKa = 6.54HH65 pKa = 6.72PLEE68 pKa = 4.66TDD70 pKa = 3.34TLFIKK75 pKa = 8.66VHH77 pKa = 4.51KK78 pKa = 9.65HH79 pKa = 4.52IPEE82 pKa = 4.38FCHH85 pKa = 6.88SFLSHH90 pKa = 7.16LLGGEE95 pKa = 4.26DD96 pKa = 5.45DD97 pKa = 5.51DD98 pKa = 5.63NALIDD103 pKa = 3.49IGLFFNMLQPSLGGWITKK121 pKa = 10.07NFLRR125 pKa = 11.84HH126 pKa = 5.84PNRR129 pKa = 11.84MSKK132 pKa = 10.53DD133 pKa = 3.65QIKK136 pKa = 9.55MLLDD140 pKa = 3.72QIIKK144 pKa = 8.36MAKK147 pKa = 9.8AEE149 pKa = 4.11SSDD152 pKa = 3.35TEE154 pKa = 4.26EE155 pKa = 4.84YY156 pKa = 10.29EE157 pKa = 4.56KK158 pKa = 10.9VWKK161 pKa = 10.57KK162 pKa = 9.55MPTYY166 pKa = 10.04FEE168 pKa = 5.9SIIQPLLHH176 pKa = 6.1KK177 pKa = 9.26TT178 pKa = 3.39
MM1 pKa = 7.46QDD3 pKa = 2.94VQRR6 pKa = 11.84TIEE9 pKa = 4.12VSVGPIVGLDD19 pKa = 3.21YY20 pKa = 11.19TLLYY24 pKa = 8.88DD25 pKa = 4.16TLPEE29 pKa = 4.2TVSDD33 pKa = 4.77NITLPDD39 pKa = 3.69LKK41 pKa = 10.92DD42 pKa = 3.57PEE44 pKa = 4.69RR45 pKa = 11.84VTEE48 pKa = 4.05DD49 pKa = 3.08TKK51 pKa = 11.68KK52 pKa = 10.9LILKK56 pKa = 8.1GCVYY60 pKa = 10.44IAYY63 pKa = 8.74HH64 pKa = 6.54HH65 pKa = 6.72PLEE68 pKa = 4.66TDD70 pKa = 3.34TLFIKK75 pKa = 8.66VHH77 pKa = 4.51KK78 pKa = 9.65HH79 pKa = 4.52IPEE82 pKa = 4.38FCHH85 pKa = 6.88SFLSHH90 pKa = 7.16LLGGEE95 pKa = 4.26DD96 pKa = 5.45DD97 pKa = 5.51DD98 pKa = 5.63NALIDD103 pKa = 3.49IGLFFNMLQPSLGGWITKK121 pKa = 10.07NFLRR125 pKa = 11.84HH126 pKa = 5.84PNRR129 pKa = 11.84MSKK132 pKa = 10.53DD133 pKa = 3.65QIKK136 pKa = 9.55MLLDD140 pKa = 3.72QIIKK144 pKa = 8.36MAKK147 pKa = 9.8AEE149 pKa = 4.11SSDD152 pKa = 3.35TEE154 pKa = 4.26EE155 pKa = 4.84YY156 pKa = 10.29EE157 pKa = 4.56KK158 pKa = 10.9VWKK161 pKa = 10.57KK162 pKa = 9.55MPTYY166 pKa = 10.04FEE168 pKa = 5.9SIIQPLLHH176 pKa = 6.1KK177 pKa = 9.26TT178 pKa = 3.39
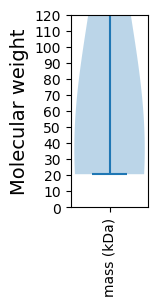
Molecular weight: 20.54 kDa
Isoelectric point according different methods:
Protein with the highest isoelectric point:
>sp|Q85429|GLYC_RSVT Putative envelope glycoprotein OS=Rice stripe virus (isolate T) OX=36394 GN=pc2 PE=1 SV=1
MM1 pKa = 7.54ALSRR5 pKa = 11.84LLSTLKK11 pKa = 10.91SKK13 pKa = 10.61VLYY16 pKa = 10.3DD17 pKa = 3.98DD18 pKa = 5.58LSEE21 pKa = 4.24EE22 pKa = 4.11SQKK25 pKa = 10.89RR26 pKa = 11.84VDD28 pKa = 3.41NKK30 pKa = 10.31NRR32 pKa = 11.84KK33 pKa = 8.81SLALSKK39 pKa = 10.79RR40 pKa = 11.84PLNQGRR46 pKa = 11.84VTIDD50 pKa = 2.91QAATMLGLEE59 pKa = 4.61PFSFSDD65 pKa = 3.58VKK67 pKa = 10.79VNKK70 pKa = 9.95YY71 pKa = 11.5DD72 pKa = 3.54MFIAKK77 pKa = 9.29QDD79 pKa = 3.77YY80 pKa = 9.64SVKK83 pKa = 10.03AHH85 pKa = 6.9RR86 pKa = 11.84KK87 pKa = 6.93ATFNILVDD95 pKa = 4.67PYY97 pKa = 10.43WFHH100 pKa = 6.93QPLTHH105 pKa = 6.25YY106 pKa = 10.35PFFRR110 pKa = 11.84VEE112 pKa = 3.86TFAMVWIGIKK122 pKa = 10.34GRR124 pKa = 11.84ASGITTLRR132 pKa = 11.84IIDD135 pKa = 3.71KK136 pKa = 10.76SYY138 pKa = 11.43VNPSDD143 pKa = 3.51QVEE146 pKa = 4.33VEE148 pKa = 3.75VRR150 pKa = 11.84YY151 pKa = 9.28PISKK155 pKa = 9.91NFAVLGSLANFLALEE170 pKa = 4.71DD171 pKa = 3.66KK172 pKa = 11.15HH173 pKa = 7.22NLQVSVSVDD182 pKa = 3.14DD183 pKa = 5.47SSVQNCVISRR193 pKa = 11.84TLWFWGIEE201 pKa = 4.13RR202 pKa = 11.84TDD204 pKa = 4.19LPVSMKK210 pKa = 10.77TNDD213 pKa = 3.13TVMFEE218 pKa = 4.29FEE220 pKa = 4.26PLEE223 pKa = 4.52DD224 pKa = 3.42KK225 pKa = 10.99AINHH229 pKa = 6.85LSSFSNFTTNVVQKK243 pKa = 10.6AVGGAFTSKK252 pKa = 10.4SFPEE256 pKa = 4.34LDD258 pKa = 3.41TEE260 pKa = 4.65KK261 pKa = 10.87EE262 pKa = 4.1FGVVKK267 pKa = 10.17QPKK270 pKa = 9.4KK271 pKa = 10.54IPITKK276 pKa = 9.52KK277 pKa = 9.71SKK279 pKa = 10.72SEE281 pKa = 3.75VSVIMM286 pKa = 4.56
MM1 pKa = 7.54ALSRR5 pKa = 11.84LLSTLKK11 pKa = 10.91SKK13 pKa = 10.61VLYY16 pKa = 10.3DD17 pKa = 3.98DD18 pKa = 5.58LSEE21 pKa = 4.24EE22 pKa = 4.11SQKK25 pKa = 10.89RR26 pKa = 11.84VDD28 pKa = 3.41NKK30 pKa = 10.31NRR32 pKa = 11.84KK33 pKa = 8.81SLALSKK39 pKa = 10.79RR40 pKa = 11.84PLNQGRR46 pKa = 11.84VTIDD50 pKa = 2.91QAATMLGLEE59 pKa = 4.61PFSFSDD65 pKa = 3.58VKK67 pKa = 10.79VNKK70 pKa = 9.95YY71 pKa = 11.5DD72 pKa = 3.54MFIAKK77 pKa = 9.29QDD79 pKa = 3.77YY80 pKa = 9.64SVKK83 pKa = 10.03AHH85 pKa = 6.9RR86 pKa = 11.84KK87 pKa = 6.93ATFNILVDD95 pKa = 4.67PYY97 pKa = 10.43WFHH100 pKa = 6.93QPLTHH105 pKa = 6.25YY106 pKa = 10.35PFFRR110 pKa = 11.84VEE112 pKa = 3.86TFAMVWIGIKK122 pKa = 10.34GRR124 pKa = 11.84ASGITTLRR132 pKa = 11.84IIDD135 pKa = 3.71KK136 pKa = 10.76SYY138 pKa = 11.43VNPSDD143 pKa = 3.51QVEE146 pKa = 4.33VEE148 pKa = 3.75VRR150 pKa = 11.84YY151 pKa = 9.28PISKK155 pKa = 9.91NFAVLGSLANFLALEE170 pKa = 4.71DD171 pKa = 3.66KK172 pKa = 11.15HH173 pKa = 7.22NLQVSVSVDD182 pKa = 3.14DD183 pKa = 5.47SSVQNCVISRR193 pKa = 11.84TLWFWGIEE201 pKa = 4.13RR202 pKa = 11.84TDD204 pKa = 4.19LPVSMKK210 pKa = 10.77TNDD213 pKa = 3.13TVMFEE218 pKa = 4.29FEE220 pKa = 4.26PLEE223 pKa = 4.52DD224 pKa = 3.42KK225 pKa = 10.99AINHH229 pKa = 6.85LSSFSNFTTNVVQKK243 pKa = 10.6AVGGAFTSKK252 pKa = 10.4SFPEE256 pKa = 4.34LDD258 pKa = 3.41TEE260 pKa = 4.65KK261 pKa = 10.87EE262 pKa = 4.1FGVVKK267 pKa = 10.17QPKK270 pKa = 9.4KK271 pKa = 10.54IPITKK276 pKa = 9.52KK277 pKa = 9.71SKK279 pKa = 10.72SEE281 pKa = 3.75VSVIMM286 pKa = 4.56
Molecular weight: 32.48 kDa
Isoelectric point according different methods:
Peptides (in silico digests for buttom-up proteomics)
Below you can find in silico digests of the whole proteome with Trypsin, Chymotrypsin, Trypsin+LysC, LysN, ArgC proteases suitable for different mass spec machines.| Try ESI |
 |
|---|
| ChTry ESI |
 |
|---|
| ArgC ESI |
 |
|---|
| LysN ESI |
 |
|---|
| TryLysC ESI |
 |
|---|
| Try MALDI |
 |
|---|
| ChTry MALDI |
 |
|---|
| ArgC MALDI |
 |
|---|
| LysN MALDI |
 |
|---|
| TryLysC MALDI |
 |
|---|
| Try LTQ |
 |
|---|
| ChTry LTQ |
 |
|---|
| ArgC LTQ |
 |
|---|
| LysN LTQ |
 |
|---|
| TryLysC LTQ |
 |
|---|
| Try MSlow |
 |
|---|
| ChTry MSlow |
 |
|---|
| ArgC MSlow |
 |
|---|
| LysN MSlow |
 |
|---|
| TryLysC MSlow |
 |
|---|
| Try MShigh |
 |
|---|
| ChTry MShigh |
 |
|---|
| ArgC MShigh |
 |
|---|
| LysN MShigh |
 |
|---|
| TryLysC MShigh |
 |
|---|
General Statistics
Number of major isoforms |
Number of additional isoforms |
Number of all proteins |
Number of amino acids |
Min. Seq. Length |
Max. Seq. Length |
Avg. Seq. Length |
Avg. Mol. Weight |
|---|---|---|---|---|---|---|---|
0 |
4949 |
178 |
2919 |
707.0 |
80.82 |
Amino acid frequency
Ala |
Cys |
Asp |
Glu |
Phe |
Gly |
His |
Ile |
Lys |
Leu |
|---|---|---|---|---|---|---|---|---|---|
4.688 ± 0.538 | 1.879 ± 0.589 |
5.981 ± 0.335 | 6.87 ± 0.86 |
4.304 ± 0.239 | 4.344 ± 0.416 |
2.566 ± 0.438 | 7.072 ± 0.519 |
7.961 ± 0.348 | 9.578 ± 0.379 |
Met |
Asn |
Gln |
Pro |
Arg |
Ser |
Thr |
Val |
Trp |
Tyr |
|---|---|---|---|---|---|---|---|---|---|
2.728 ± 0.147 | 4.607 ± 0.262 |
3.718 ± 0.686 | 3.011 ± 0.475 |
4.344 ± 0.562 | 8.487 ± 0.654 |
6.021 ± 0.549 | 6.668 ± 0.453 |
1.152 ± 0.169 | 4.021 ± 0.257 |
Most of the basic statistics you can see at this page can be downloaded from this CSV file
Proteome-pI is available under Creative Commons Attribution-NoDerivs license, for more details see here
| Reference: Kozlowski LP. Proteome-pI 2.0: Proteome Isoelectric Point Database Update. Nucleic Acids Res. 2021, doi: 10.1093/nar/gkab944 | Contact: Lukasz P. Kozlowski |
