Apple stem pitting virus (isolate PA66) (ASPV)
Taxonomy: Viruses; Riboviria; Orthornavirae; Kitrinoviricota; Alsuviricetes; Tymovirales; Betaflexiviridae; Quinvirinae; Foveavirus; Apple stem pitting virus
Average proteome isoelectric point is 6.68
Get precalculated fractions of proteins

Virtual 2D-PAGE plot for 5 proteins (isoelectric point calculated using IPC2_protein)
Get csv file with sequences according to given criteria:
* You can choose from 21 different methods for calculating isoelectric point
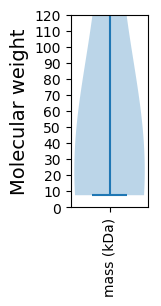
Summary statistics related to proteome-wise predictions


Protein with the lowest isoelectric point:
>sp|Q64966|CAPSD_ASPVP Capsid protein OS=Apple stem pitting virus (isolate PA66) OX=651356 GN=ORF5 PE=4 SV=1
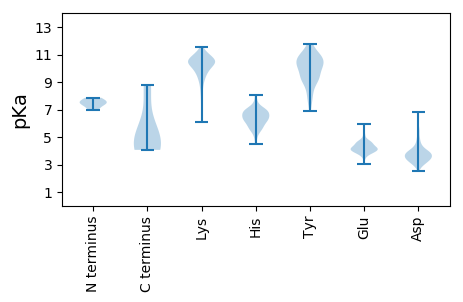
MM1 pKa = 7.47FPRR4 pKa = 11.84SGLGLAVAAAVVAYY18 pKa = 9.96LVLLLAQQLYY28 pKa = 9.26MSNSSQCTIVITGEE42 pKa = 4.12SVSVVGCVYY51 pKa = 10.74SEE53 pKa = 4.14AFIEE57 pKa = 4.21LVKK60 pKa = 10.72GLKK63 pKa = 9.64PYY65 pKa = 9.38YY66 pKa = 10.08HH67 pKa = 7.57PLGG70 pKa = 4.07
MM1 pKa = 7.47FPRR4 pKa = 11.84SGLGLAVAAAVVAYY18 pKa = 9.96LVLLLAQQLYY28 pKa = 9.26MSNSSQCTIVITGEE42 pKa = 4.12SVSVVGCVYY51 pKa = 10.74SEE53 pKa = 4.14AFIEE57 pKa = 4.21LVKK60 pKa = 10.72GLKK63 pKa = 9.64PYY65 pKa = 9.38YY66 pKa = 10.08HH67 pKa = 7.57PLGG70 pKa = 4.07
Molecular weight: 7.44 kDa
Isoelectric point according different methods:
Protein with the highest isoelectric point:
>sp|Q64965|TGB3_ASPVP Movement protein TGBp3 OS=Apple stem pitting virus (isolate PA66) OX=651356 GN=ORF4 PE=3 SV=1
MM1 pKa = 7.86PFAQPPDD8 pKa = 3.53YY9 pKa = 10.39SKK11 pKa = 11.3SVFPIAVGIAVAVVLFTLTRR31 pKa = 11.84STLPQVGDD39 pKa = 3.89NIHH42 pKa = 6.29NLPHH46 pKa = 6.56GGNYY50 pKa = 9.26QDD52 pKa = 3.31GTKK55 pKa = 10.06RR56 pKa = 11.84ISYY59 pKa = 9.2CGPRR63 pKa = 11.84DD64 pKa = 3.81SFPSSSLISSGTPMIIGIIIFLIFAIYY91 pKa = 10.37VSEE94 pKa = 3.81KK95 pKa = 8.64WSRR98 pKa = 11.84SGSRR102 pKa = 11.84RR103 pKa = 11.84CSCCVPGAPACTATVHH119 pKa = 5.72EE120 pKa = 4.63
MM1 pKa = 7.86PFAQPPDD8 pKa = 3.53YY9 pKa = 10.39SKK11 pKa = 11.3SVFPIAVGIAVAVVLFTLTRR31 pKa = 11.84STLPQVGDD39 pKa = 3.89NIHH42 pKa = 6.29NLPHH46 pKa = 6.56GGNYY50 pKa = 9.26QDD52 pKa = 3.31GTKK55 pKa = 10.06RR56 pKa = 11.84ISYY59 pKa = 9.2CGPRR63 pKa = 11.84DD64 pKa = 3.81SFPSSSLISSGTPMIIGIIIFLIFAIYY91 pKa = 10.37VSEE94 pKa = 3.81KK95 pKa = 8.64WSRR98 pKa = 11.84SGSRR102 pKa = 11.84RR103 pKa = 11.84CSCCVPGAPACTATVHH119 pKa = 5.72EE120 pKa = 4.63
Molecular weight: 12.85 kDa
Isoelectric point according different methods:
Peptides (in silico digests for buttom-up proteomics)
Below you can find in silico digests of the whole proteome with Trypsin, Chymotrypsin, Trypsin+LysC, LysN, ArgC proteases suitable for different mass spec machines.| Try ESI |
 |
|---|
| ChTry ESI |
 |
|---|
| ArgC ESI |
 |
|---|
| LysN ESI |
 |
|---|
| TryLysC ESI |
 |
|---|
| Try MALDI |
 |
|---|
| ChTry MALDI |
 |
|---|
| ArgC MALDI |
 |
|---|
| LysN MALDI |
 |
|---|
| TryLysC MALDI |
 |
|---|
| Try LTQ |
 |
|---|
| ChTry LTQ |
 |
|---|
| ArgC LTQ |
 |
|---|
| LysN LTQ |
 |
|---|
| TryLysC LTQ |
 |
|---|
| Try MSlow |
 |
|---|
| ChTry MSlow |
 |
|---|
| ArgC MSlow |
 |
|---|
| LysN MSlow |
 |
|---|
| TryLysC MSlow |
 |
|---|
| Try MShigh |
 |
|---|
| ChTry MShigh |
 |
|---|
| ArgC MShigh |
 |
|---|
| LysN MShigh |
 |
|---|
| TryLysC MShigh |
 |
|---|
General Statistics
Number of major isoforms |
Number of additional isoforms |
Number of all proteins |
Number of amino acids |
Min. Seq. Length |
Max. Seq. Length |
Avg. Seq. Length |
Avg. Mol. Weight |
|---|---|---|---|---|---|---|---|
0 |
3010 |
70 |
2183 |
602.0 |
67.29 |
Amino acid frequency
Ala |
Cys |
Asp |
Glu |
Phe |
Gly |
His |
Ile |
Lys |
Leu |
|---|---|---|---|---|---|---|---|---|---|
6.777 ± 1.537 | 2.392 ± 0.466 |
5.017 ± 1.369 | 6.412 ± 0.725 |
5.947 ± 0.953 | 6.611 ± 1.119 |
2.924 ± 0.38 | 6.246 ± 0.772 |
5.88 ± 1.385 | 9.535 ± 1.526 |
Met |
Asn |
Gln |
Pro |
Arg |
Ser |
Thr |
Val |
Trp |
Tyr |
|---|---|---|---|---|---|---|---|---|---|
1.993 ± 0.287 | 4.385 ± 0.46 |
4.718 ± 1.3 | 3.09 ± 0.738 |
5.316 ± 0.447 | 8.339 ± 0.803 |
4.817 ± 0.69 | 6.213 ± 1.203 |
0.897 ± 0.228 | 2.492 ± 0.616 |
Most of the basic statistics you can see at this page can be downloaded from this CSV file
Proteome-pI is available under Creative Commons Attribution-NoDerivs license, for more details see here
| Reference: Kozlowski LP. Proteome-pI 2.0: Proteome Isoelectric Point Database Update. Nucleic Acids Res. 2021, doi: 10.1093/nar/gkab944 | Contact: Lukasz P. Kozlowski |
