Methylophaga thiooxydans DMS010
Taxonomy: cellular organisms; Bacteria; Proteobacteria; Gammaproteobacteria; Thiotrichales; Piscirickettsiaceae; Methylophaga; Methylophaga thiooxydans
Average proteome isoelectric point is 5.97
Get precalculated fractions of proteins

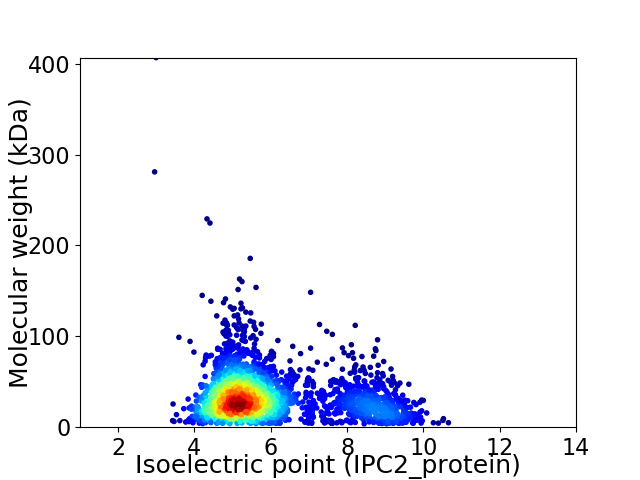
Virtual 2D-PAGE plot for 2492 proteins (isoelectric point calculated using IPC2_protein)
Get csv file with sequences according to given criteria:
* You can choose from 21 different methods for calculating isoelectric point
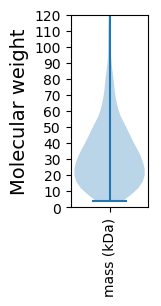
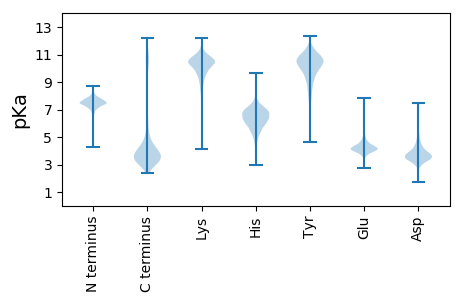
Summary statistics related to proteome-wise predictions


Protein with the lowest isoelectric point:
>tr|C0N7W6|C0N7W6_9GAMM Chaperone SurA OS=Methylophaga thiooxydans DMS010 OX=637616 GN=surA PE=3 SV=1
MM1 pKa = 7.65WFLLFDD7 pKa = 4.79RR8 pKa = 11.84PNKK11 pKa = 10.55AYY13 pKa = 10.55FSNNRR18 pKa = 11.84QAGFTLVEE26 pKa = 3.88ILLVIVLLGIVSIAAINAFSGNEE49 pKa = 3.65DD50 pKa = 3.09QARR53 pKa = 11.84QNVTRR58 pKa = 11.84LEE60 pKa = 3.96MAEE63 pKa = 4.04LQKK66 pKa = 11.42ALLQFRR72 pKa = 11.84RR73 pKa = 11.84DD74 pKa = 3.66NRR76 pKa = 11.84EE77 pKa = 3.94LPCMVYY83 pKa = 10.23RR84 pKa = 11.84QGDD87 pKa = 4.03FSPNTVNDD95 pKa = 3.52VNAHH99 pKa = 5.1EE100 pKa = 4.86NYY102 pKa = 10.72NDD104 pKa = 3.4FTVGFDD110 pKa = 3.84LTPLPADD117 pKa = 4.8AIAWQDD123 pKa = 3.11WCQEE127 pKa = 3.94NYY129 pKa = 10.6NNSAGEE135 pKa = 4.3TIASNALVMLNQFPYY150 pKa = 10.6DD151 pKa = 3.15IAEE154 pKa = 4.06FDD156 pKa = 3.7FLLWNGSTQQGWNGAYY172 pKa = 9.5ISQEE176 pKa = 3.79GLTDD180 pKa = 3.01SWGNAYY186 pKa = 9.57ILLDD190 pKa = 3.57PEE192 pKa = 5.13LIYY195 pKa = 10.4GARR198 pKa = 11.84YY199 pKa = 9.15RR200 pKa = 11.84CLINSGGDD208 pKa = 3.46DD209 pKa = 3.75YY210 pKa = 11.95DD211 pKa = 3.68ATGDD215 pKa = 4.0LYY217 pKa = 11.41EE218 pKa = 5.19CLTPSDD224 pKa = 3.97VGFVAADD231 pKa = 4.03HH232 pKa = 6.64ILPADD237 pKa = 3.68TARR240 pKa = 11.84IISPGPDD247 pKa = 3.14GEE249 pKa = 4.57IDD251 pKa = 3.48PDD253 pKa = 3.62YY254 pKa = 11.15DD255 pKa = 4.14ANPVSGNDD263 pKa = 3.33PCIAEE268 pKa = 4.34GDD270 pKa = 4.03DD271 pKa = 6.29LILCLMRR278 pKa = 6.29
MM1 pKa = 7.65WFLLFDD7 pKa = 4.79RR8 pKa = 11.84PNKK11 pKa = 10.55AYY13 pKa = 10.55FSNNRR18 pKa = 11.84QAGFTLVEE26 pKa = 3.88ILLVIVLLGIVSIAAINAFSGNEE49 pKa = 3.65DD50 pKa = 3.09QARR53 pKa = 11.84QNVTRR58 pKa = 11.84LEE60 pKa = 3.96MAEE63 pKa = 4.04LQKK66 pKa = 11.42ALLQFRR72 pKa = 11.84RR73 pKa = 11.84DD74 pKa = 3.66NRR76 pKa = 11.84EE77 pKa = 3.94LPCMVYY83 pKa = 10.23RR84 pKa = 11.84QGDD87 pKa = 4.03FSPNTVNDD95 pKa = 3.52VNAHH99 pKa = 5.1EE100 pKa = 4.86NYY102 pKa = 10.72NDD104 pKa = 3.4FTVGFDD110 pKa = 3.84LTPLPADD117 pKa = 4.8AIAWQDD123 pKa = 3.11WCQEE127 pKa = 3.94NYY129 pKa = 10.6NNSAGEE135 pKa = 4.3TIASNALVMLNQFPYY150 pKa = 10.6DD151 pKa = 3.15IAEE154 pKa = 4.06FDD156 pKa = 3.7FLLWNGSTQQGWNGAYY172 pKa = 9.5ISQEE176 pKa = 3.79GLTDD180 pKa = 3.01SWGNAYY186 pKa = 9.57ILLDD190 pKa = 3.57PEE192 pKa = 5.13LIYY195 pKa = 10.4GARR198 pKa = 11.84YY199 pKa = 9.15RR200 pKa = 11.84CLINSGGDD208 pKa = 3.46DD209 pKa = 3.75YY210 pKa = 11.95DD211 pKa = 3.68ATGDD215 pKa = 4.0LYY217 pKa = 11.41EE218 pKa = 5.19CLTPSDD224 pKa = 3.97VGFVAADD231 pKa = 4.03HH232 pKa = 6.64ILPADD237 pKa = 3.68TARR240 pKa = 11.84IISPGPDD247 pKa = 3.14GEE249 pKa = 4.57IDD251 pKa = 3.48PDD253 pKa = 3.62YY254 pKa = 11.15DD255 pKa = 4.14ANPVSGNDD263 pKa = 3.33PCIAEE268 pKa = 4.34GDD270 pKa = 4.03DD271 pKa = 6.29LILCLMRR278 pKa = 6.29
Molecular weight: 30.96 kDa
Isoelectric point according different methods:
Protein with the highest isoelectric point:
>tr|C0N8V6|C0N8V6_9GAMM zf-CHCC domain-containing protein OS=Methylophaga thiooxydans DMS010 OX=637616 GN=MDMS009_2558 PE=4 SV=1
MM1 pKa = 7.32NEE3 pKa = 3.84STIVLLVLSLLGWLWWDD20 pKa = 3.17SRR22 pKa = 11.84GVAEE26 pKa = 4.77RR27 pKa = 11.84ATIAARR33 pKa = 11.84AYY35 pKa = 9.8CGNAGVSFLNDD46 pKa = 3.06TVAWQKK52 pKa = 9.83MRR54 pKa = 11.84LKK56 pKa = 10.59RR57 pKa = 11.84NRR59 pKa = 11.84QGRR62 pKa = 11.84MQLHH66 pKa = 5.1RR67 pKa = 11.84TYY69 pKa = 10.61FFEE72 pKa = 4.83FASDD76 pKa = 3.18MQQRR80 pKa = 11.84YY81 pKa = 9.01RR82 pKa = 11.84GQIIMLGKK90 pKa = 10.03KK91 pKa = 9.69VEE93 pKa = 4.36SVSLDD98 pKa = 3.23VFRR101 pKa = 11.84AAEE104 pKa = 3.86RR105 pKa = 3.64
MM1 pKa = 7.32NEE3 pKa = 3.84STIVLLVLSLLGWLWWDD20 pKa = 3.17SRR22 pKa = 11.84GVAEE26 pKa = 4.77RR27 pKa = 11.84ATIAARR33 pKa = 11.84AYY35 pKa = 9.8CGNAGVSFLNDD46 pKa = 3.06TVAWQKK52 pKa = 9.83MRR54 pKa = 11.84LKK56 pKa = 10.59RR57 pKa = 11.84NRR59 pKa = 11.84QGRR62 pKa = 11.84MQLHH66 pKa = 5.1RR67 pKa = 11.84TYY69 pKa = 10.61FFEE72 pKa = 4.83FASDD76 pKa = 3.18MQQRR80 pKa = 11.84YY81 pKa = 9.01RR82 pKa = 11.84GQIIMLGKK90 pKa = 10.03KK91 pKa = 9.69VEE93 pKa = 4.36SVSLDD98 pKa = 3.23VFRR101 pKa = 11.84AAEE104 pKa = 3.86RR105 pKa = 3.64
Molecular weight: 12.22 kDa
Isoelectric point according different methods:
Peptides (in silico digests for buttom-up proteomics)
Below you can find in silico digests of the whole proteome with Trypsin, Chymotrypsin, Trypsin+LysC, LysN, ArgC proteases suitable for different mass spec machines.| Try ESI |
 |
|---|
| ChTry ESI |
 |
|---|
| ArgC ESI |
 |
|---|
| LysN ESI |
 |
|---|
| TryLysC ESI |
 |
|---|
| Try MALDI |
 |
|---|
| ChTry MALDI |
 |
|---|
| ArgC MALDI |
 |
|---|
| LysN MALDI |
 |
|---|
| TryLysC MALDI |
 |
|---|
| Try LTQ |
 |
|---|
| ChTry LTQ |
 |
|---|
| ArgC LTQ |
 |
|---|
| LysN LTQ |
 |
|---|
| TryLysC LTQ |
 |
|---|
| Try MSlow |
 |
|---|
| ChTry MSlow |
 |
|---|
| ArgC MSlow |
 |
|---|
| LysN MSlow |
 |
|---|
| TryLysC MSlow |
 |
|---|
| Try MShigh |
 |
|---|
| ChTry MShigh |
 |
|---|
| ArgC MShigh |
 |
|---|
| LysN MShigh |
 |
|---|
| TryLysC MShigh |
 |
|---|
General Statistics
Number of major isoforms |
Number of additional isoforms |
Number of all proteins |
Number of amino acids |
Min. Seq. Length |
Max. Seq. Length |
Avg. Seq. Length |
Avg. Mol. Weight |
|---|---|---|---|---|---|---|---|
0 |
781252 |
37 |
3937 |
313.5 |
34.82 |
Amino acid frequency
Ala |
Cys |
Asp |
Glu |
Phe |
Gly |
His |
Ile |
Lys |
Leu |
|---|---|---|---|---|---|---|---|---|---|
9.024 ± 0.048 | 0.891 ± 0.017 |
6.046 ± 0.052 | 6.296 ± 0.044 |
3.924 ± 0.033 | 6.859 ± 0.056 |
2.422 ± 0.027 | 6.272 ± 0.037 |
4.757 ± 0.047 | 10.504 ± 0.058 |
Met |
Asn |
Gln |
Pro |
Arg |
Ser |
Thr |
Val |
Trp |
Tyr |
|---|---|---|---|---|---|---|---|---|---|
2.681 ± 0.023 | 3.959 ± 0.035 |
4.031 ± 0.03 | 4.814 ± 0.043 |
4.969 ± 0.047 | 6.141 ± 0.042 |
5.466 ± 0.044 | 6.864 ± 0.037 |
1.284 ± 0.021 | 2.796 ± 0.028 |
Most of the basic statistics you can see at this page can be downloaded from this CSV file
Proteome-pI is available under Creative Commons Attribution-NoDerivs license, for more details see here
| Reference: Kozlowski LP. Proteome-pI 2.0: Proteome Isoelectric Point Database Update. Nucleic Acids Res. 2021, doi: 10.1093/nar/gkab944 | Contact: Lukasz P. Kozlowski |
