Wolbachia pipientis
Taxonomy: cellular organisms; Bacteria; Proteobacteria; Alphaproteobacteria; Rickettsiales; Anaplasmataceae; Wolbachieae; Wolbachia
Average proteome isoelectric point is 7.07
Get precalculated fractions of proteins

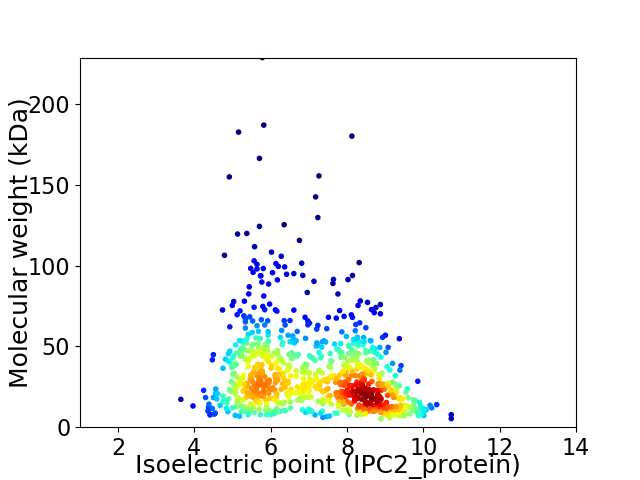
Virtual 2D-PAGE plot for 851 proteins (isoelectric point calculated using IPC2_protein)
Get csv file with sequences according to given criteria:
* You can choose from 21 different methods for calculating isoelectric point
Summary statistics related to proteome-wise predictions


Protein with the lowest isoelectric point:
>tr|A0A1E7QJR4|A0A1E7QJR4_WOLPI Probable lipid II flippase MurJ OS=Wolbachia pipientis OX=955 GN=murJ PE=3 SV=1
MM1 pKa = 6.62STNYY5 pKa = 10.5NINLTDD11 pKa = 3.29NALRR15 pKa = 11.84KK16 pKa = 9.17IRR18 pKa = 11.84SIAEE22 pKa = 3.79QEE24 pKa = 4.12EE25 pKa = 4.72TQGSVLRR32 pKa = 11.84IAVSGGGCSGFKK44 pKa = 10.36YY45 pKa = 10.68DD46 pKa = 5.7FLIDD50 pKa = 3.73QLSSEE55 pKa = 4.27GDD57 pKa = 3.21KK58 pKa = 11.27DD59 pKa = 5.42DD60 pKa = 5.12EE61 pKa = 5.53FEE63 pKa = 5.94DD64 pKa = 6.04DD65 pKa = 5.32YY66 pKa = 11.98DD67 pKa = 6.37DD68 pKa = 5.16EE69 pKa = 7.64DD70 pKa = 5.53GDD72 pKa = 4.24EE73 pKa = 5.81DD74 pKa = 4.87GDD76 pKa = 3.8EE77 pKa = 5.67DD78 pKa = 5.39GDD80 pKa = 3.88FDD82 pKa = 5.71EE83 pKa = 7.24DD84 pKa = 5.42EE85 pKa = 5.06EE86 pKa = 6.85DD87 pKa = 6.12DD88 pKa = 5.35DD89 pKa = 6.42DD90 pKa = 7.09DD91 pKa = 4.69YY92 pKa = 12.26YY93 pKa = 11.47KK94 pKa = 11.41ANGKK98 pKa = 10.12YY99 pKa = 9.89IVISDD104 pKa = 4.06CNGNPVLMIDD114 pKa = 3.34NHH116 pKa = 5.52SAEE119 pKa = 4.11FLKK122 pKa = 10.94DD123 pKa = 3.47SVIDD127 pKa = 3.84YY128 pKa = 11.38VEE130 pKa = 4.61DD131 pKa = 3.61LSGAGFQIKK140 pKa = 10.24SEE142 pKa = 4.14IAKK145 pKa = 8.39SHH147 pKa = 6.34CGCGNSFAII156 pKa = 4.89
MM1 pKa = 6.62STNYY5 pKa = 10.5NINLTDD11 pKa = 3.29NALRR15 pKa = 11.84KK16 pKa = 9.17IRR18 pKa = 11.84SIAEE22 pKa = 3.79QEE24 pKa = 4.12EE25 pKa = 4.72TQGSVLRR32 pKa = 11.84IAVSGGGCSGFKK44 pKa = 10.36YY45 pKa = 10.68DD46 pKa = 5.7FLIDD50 pKa = 3.73QLSSEE55 pKa = 4.27GDD57 pKa = 3.21KK58 pKa = 11.27DD59 pKa = 5.42DD60 pKa = 5.12EE61 pKa = 5.53FEE63 pKa = 5.94DD64 pKa = 6.04DD65 pKa = 5.32YY66 pKa = 11.98DD67 pKa = 6.37DD68 pKa = 5.16EE69 pKa = 7.64DD70 pKa = 5.53GDD72 pKa = 4.24EE73 pKa = 5.81DD74 pKa = 4.87GDD76 pKa = 3.8EE77 pKa = 5.67DD78 pKa = 5.39GDD80 pKa = 3.88FDD82 pKa = 5.71EE83 pKa = 7.24DD84 pKa = 5.42EE85 pKa = 5.06EE86 pKa = 6.85DD87 pKa = 6.12DD88 pKa = 5.35DD89 pKa = 6.42DD90 pKa = 7.09DD91 pKa = 4.69YY92 pKa = 12.26YY93 pKa = 11.47KK94 pKa = 11.41ANGKK98 pKa = 10.12YY99 pKa = 9.89IVISDD104 pKa = 4.06CNGNPVLMIDD114 pKa = 3.34NHH116 pKa = 5.52SAEE119 pKa = 4.11FLKK122 pKa = 10.94DD123 pKa = 3.47SVIDD127 pKa = 3.84YY128 pKa = 11.38VEE130 pKa = 4.61DD131 pKa = 3.61LSGAGFQIKK140 pKa = 10.24SEE142 pKa = 4.14IAKK145 pKa = 8.39SHH147 pKa = 6.34CGCGNSFAII156 pKa = 4.89
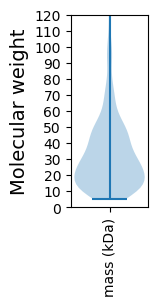
Molecular weight: 17.23 kDa
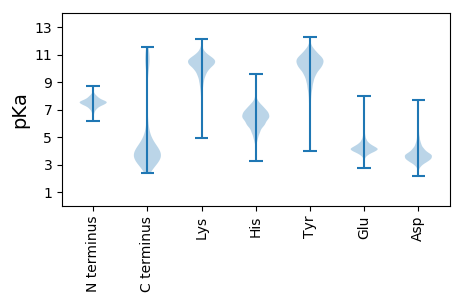
Isoelectric point according different methods:
Protein with the highest isoelectric point:
>tr|A0A1E7QJ05|A0A1E7QJ05_WOLPI Holo-[acyl-carrier-protein] synthase OS=Wolbachia pipientis OX=955 GN=acpS PE=3 SV=1
MM1 pKa = 7.45KK2 pKa = 9.61RR3 pKa = 11.84TFQPKK8 pKa = 8.99NLIRR12 pKa = 11.84KK13 pKa = 8.2RR14 pKa = 11.84RR15 pKa = 11.84HH16 pKa = 4.34GFRR19 pKa = 11.84TRR21 pKa = 11.84MATRR25 pKa = 11.84AGRR28 pKa = 11.84KK29 pKa = 7.83ILNRR33 pKa = 11.84RR34 pKa = 11.84RR35 pKa = 11.84SLGCRR40 pKa = 11.84KK41 pKa = 9.8LCAA44 pKa = 4.11
MM1 pKa = 7.45KK2 pKa = 9.61RR3 pKa = 11.84TFQPKK8 pKa = 8.99NLIRR12 pKa = 11.84KK13 pKa = 8.2RR14 pKa = 11.84RR15 pKa = 11.84HH16 pKa = 4.34GFRR19 pKa = 11.84TRR21 pKa = 11.84MATRR25 pKa = 11.84AGRR28 pKa = 11.84KK29 pKa = 7.83ILNRR33 pKa = 11.84RR34 pKa = 11.84RR35 pKa = 11.84SLGCRR40 pKa = 11.84KK41 pKa = 9.8LCAA44 pKa = 4.11
Molecular weight: 5.34 kDa
Isoelectric point according different methods:
Peptides (in silico digests for buttom-up proteomics)
Below you can find in silico digests of the whole proteome with Trypsin, Chymotrypsin, Trypsin+LysC, LysN, ArgC proteases suitable for different mass spec machines.| Try ESI |
 |
|---|
| ChTry ESI |
 |
|---|
| ArgC ESI |
 |
|---|
| LysN ESI |
 |
|---|
| TryLysC ESI |
 |
|---|
| Try MALDI |
 |
|---|
| ChTry MALDI |
 |
|---|
| ArgC MALDI |
 |
|---|
| LysN MALDI |
 |
|---|
| TryLysC MALDI |
 |
|---|
| Try LTQ |
 |
|---|
| ChTry LTQ |
 |
|---|
| ArgC LTQ |
 |
|---|
| LysN LTQ |
 |
|---|
| TryLysC LTQ |
 |
|---|
| Try MSlow |
 |
|---|
| ChTry MSlow |
 |
|---|
| ArgC MSlow |
 |
|---|
| LysN MSlow |
 |
|---|
| TryLysC MSlow |
 |
|---|
| Try MShigh |
 |
|---|
| ChTry MShigh |
 |
|---|
| ArgC MShigh |
 |
|---|
| LysN MShigh |
 |
|---|
| TryLysC MShigh |
 |
|---|
General Statistics
Number of major isoforms |
Number of additional isoforms |
Number of all proteins |
Number of amino acids |
Min. Seq. Length |
Max. Seq. Length |
Avg. Seq. Length |
Avg. Mol. Weight |
|---|---|---|---|---|---|---|---|
0 |
259824 |
44 |
1975 |
305.3 |
34.51 |
Amino acid frequency
Ala |
Cys |
Asp |
Glu |
Phe |
Gly |
His |
Ile |
Lys |
Leu |
|---|---|---|---|---|---|---|---|---|---|
5.943 ± 0.07 | 1.517 ± 0.03 |
5.218 ± 0.06 | 6.043 ± 0.089 |
4.475 ± 0.067 | 5.516 ± 0.085 |
2.243 ± 0.038 | 10.063 ± 0.089 |
7.82 ± 0.082 | 9.826 ± 0.097 |
Met |
Asn |
Gln |
Pro |
Arg |
Ser |
Thr |
Val |
Trp |
Tyr |
|---|---|---|---|---|---|---|---|---|---|
2.297 ± 0.037 | 6.248 ± 0.082 |
2.954 ± 0.043 | 3.233 ± 0.053 |
3.774 ± 0.052 | 7.143 ± 0.062 |
4.835 ± 0.049 | 6.196 ± 0.065 |
0.747 ± 0.022 | 3.886 ± 0.054 |
Most of the basic statistics you can see at this page can be downloaded from this CSV file
Proteome-pI is available under Creative Commons Attribution-NoDerivs license, for more details see here
| Reference: Kozlowski LP. Proteome-pI 2.0: Proteome Isoelectric Point Database Update. Nucleic Acids Res. 2021, doi: 10.1093/nar/gkab944 | Contact: Lukasz P. Kozlowski |
