Hydrogenophaga crassostreae
Taxonomy: cellular organisms; Bacteria; Proteobacteria; Betaproteobacteria; Burkholderiales; Comamonadaceae; Hydrogenophaga
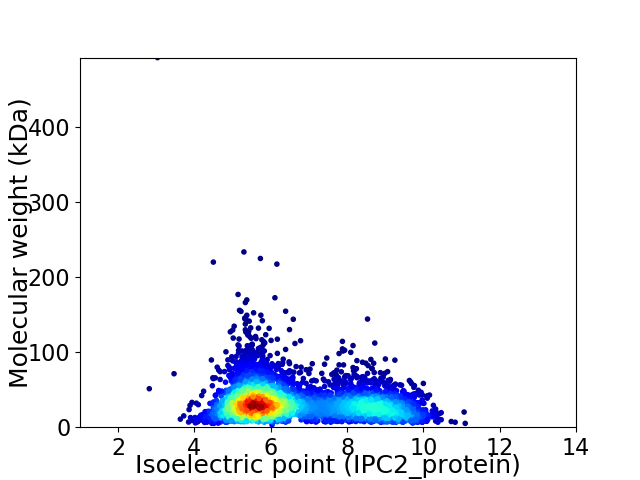
Average proteome isoelectric point is 6.68
Get precalculated fractions of proteins

Virtual 2D-PAGE plot for 4456 proteins (isoelectric point calculated using IPC2_protein)
Get csv file with sequences according to given criteria:
* You can choose from 21 different methods for calculating isoelectric point
Summary statistics related to proteome-wise predictions


Protein with the lowest isoelectric point:
>tr|A0A162W3I5|A0A162W3I5_9BURK Peptidase OS=Hydrogenophaga crassostreae OX=1763535 GN=LPB072_17715 PE=4 SV=1
MM1 pKa = 7.85SDD3 pKa = 3.32TPTTPPLTPSIEE15 pKa = 4.19DD16 pKa = 3.99AEE18 pKa = 4.5PSLPCVMVFNANDD31 pKa = 3.66PSGAGGLAADD41 pKa = 4.8LSAMGSASAHH51 pKa = 4.99VLAVVTGTYY60 pKa = 10.49VRR62 pKa = 11.84DD63 pKa = 3.34TTEE66 pKa = 3.67IHH68 pKa = 6.9DD69 pKa = 4.58HH70 pKa = 6.75FPFDD74 pKa = 4.56DD75 pKa = 4.03EE76 pKa = 5.37AVTDD80 pKa = 3.77QARR83 pKa = 11.84CALEE87 pKa = 4.41DD88 pKa = 3.59MPVQAFKK95 pKa = 11.36VGFVGSAEE103 pKa = 4.03NLSAIAAIATDD114 pKa = 3.71YY115 pKa = 11.46TEE117 pKa = 4.72IPVITYY123 pKa = 9.03MPDD126 pKa = 3.39LSWWDD131 pKa = 3.38EE132 pKa = 4.13VEE134 pKa = 3.56IDD136 pKa = 4.56NYY138 pKa = 11.33LDD140 pKa = 3.5ACAEE144 pKa = 3.97LMLPQTTVLVGNHH157 pKa = 5.01STLCRR162 pKa = 11.84WLLPDD167 pKa = 3.75WDD169 pKa = 4.38GDD171 pKa = 3.81KK172 pKa = 10.74PPPPRR177 pKa = 11.84EE178 pKa = 3.95VARR181 pKa = 11.84AAAVHH186 pKa = 5.84GVPYY190 pKa = 10.28TLVTGFNAADD200 pKa = 3.5QYY202 pKa = 11.67LEE204 pKa = 4.05SHH206 pKa = 6.85LASPEE211 pKa = 4.17TVLATARR218 pKa = 11.84YY219 pKa = 8.48EE220 pKa = 3.99RR221 pKa = 11.84FEE223 pKa = 4.21ATFSGAGDD231 pKa = 3.74TLSAALCALIANGMDD246 pKa = 3.57LQAACAEE253 pKa = 4.08ALTYY257 pKa = 10.72LDD259 pKa = 3.41QCLDD263 pKa = 3.39AGFQPGMGHH272 pKa = 7.23AVPDD276 pKa = 3.57RR277 pKa = 11.84MFWAHH282 pKa = 6.97SDD284 pKa = 3.93DD285 pKa = 3.89EE286 pKa = 5.57DD287 pKa = 3.92EE288 pKa = 5.16VEE290 pKa = 4.27PSSKK294 pKa = 9.24NTLGTEE300 pKa = 4.08DD301 pKa = 4.68FPLDD305 pKa = 3.87TTKK308 pKa = 10.67HH309 pKa = 4.89
MM1 pKa = 7.85SDD3 pKa = 3.32TPTTPPLTPSIEE15 pKa = 4.19DD16 pKa = 3.99AEE18 pKa = 4.5PSLPCVMVFNANDD31 pKa = 3.66PSGAGGLAADD41 pKa = 4.8LSAMGSASAHH51 pKa = 4.99VLAVVTGTYY60 pKa = 10.49VRR62 pKa = 11.84DD63 pKa = 3.34TTEE66 pKa = 3.67IHH68 pKa = 6.9DD69 pKa = 4.58HH70 pKa = 6.75FPFDD74 pKa = 4.56DD75 pKa = 4.03EE76 pKa = 5.37AVTDD80 pKa = 3.77QARR83 pKa = 11.84CALEE87 pKa = 4.41DD88 pKa = 3.59MPVQAFKK95 pKa = 11.36VGFVGSAEE103 pKa = 4.03NLSAIAAIATDD114 pKa = 3.71YY115 pKa = 11.46TEE117 pKa = 4.72IPVITYY123 pKa = 9.03MPDD126 pKa = 3.39LSWWDD131 pKa = 3.38EE132 pKa = 4.13VEE134 pKa = 3.56IDD136 pKa = 4.56NYY138 pKa = 11.33LDD140 pKa = 3.5ACAEE144 pKa = 3.97LMLPQTTVLVGNHH157 pKa = 5.01STLCRR162 pKa = 11.84WLLPDD167 pKa = 3.75WDD169 pKa = 4.38GDD171 pKa = 3.81KK172 pKa = 10.74PPPPRR177 pKa = 11.84EE178 pKa = 3.95VARR181 pKa = 11.84AAAVHH186 pKa = 5.84GVPYY190 pKa = 10.28TLVTGFNAADD200 pKa = 3.5QYY202 pKa = 11.67LEE204 pKa = 4.05SHH206 pKa = 6.85LASPEE211 pKa = 4.17TVLATARR218 pKa = 11.84YY219 pKa = 8.48EE220 pKa = 3.99RR221 pKa = 11.84FEE223 pKa = 4.21ATFSGAGDD231 pKa = 3.74TLSAALCALIANGMDD246 pKa = 3.57LQAACAEE253 pKa = 4.08ALTYY257 pKa = 10.72LDD259 pKa = 3.41QCLDD263 pKa = 3.39AGFQPGMGHH272 pKa = 7.23AVPDD276 pKa = 3.57RR277 pKa = 11.84MFWAHH282 pKa = 6.97SDD284 pKa = 3.93DD285 pKa = 3.89EE286 pKa = 5.57DD287 pKa = 3.92EE288 pKa = 5.16VEE290 pKa = 4.27PSSKK294 pKa = 9.24NTLGTEE300 pKa = 4.08DD301 pKa = 4.68FPLDD305 pKa = 3.87TTKK308 pKa = 10.67HH309 pKa = 4.89
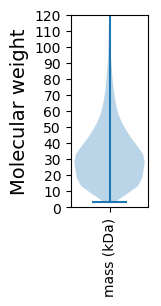
Molecular weight: 33.1 kDa
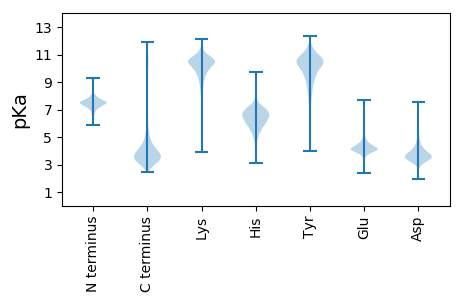
Isoelectric point according different methods:
Protein with the highest isoelectric point:
>tr|A0A163C5F1|A0A163C5F1_9BURK Histidine kinase OS=Hydrogenophaga crassostreae OX=1763535 GN=LPB072_21730 PE=4 SV=1
MM1 pKa = 7.35KK2 pKa = 9.43RR3 pKa = 11.84TYY5 pKa = 10.17QPSKK9 pKa = 9.15IKK11 pKa = 10.36RR12 pKa = 11.84ARR14 pKa = 11.84THH16 pKa = 5.98GFLVRR21 pKa = 11.84MKK23 pKa = 9.7TRR25 pKa = 11.84GGRR28 pKa = 11.84AVINARR34 pKa = 11.84RR35 pKa = 11.84AKK37 pKa = 9.58GRR39 pKa = 11.84KK40 pKa = 8.75RR41 pKa = 11.84LAVV44 pKa = 3.41
MM1 pKa = 7.35KK2 pKa = 9.43RR3 pKa = 11.84TYY5 pKa = 10.17QPSKK9 pKa = 9.15IKK11 pKa = 10.36RR12 pKa = 11.84ARR14 pKa = 11.84THH16 pKa = 5.98GFLVRR21 pKa = 11.84MKK23 pKa = 9.7TRR25 pKa = 11.84GGRR28 pKa = 11.84AVINARR34 pKa = 11.84RR35 pKa = 11.84AKK37 pKa = 9.58GRR39 pKa = 11.84KK40 pKa = 8.75RR41 pKa = 11.84LAVV44 pKa = 3.41
Molecular weight: 5.12 kDa
Isoelectric point according different methods:
Peptides (in silico digests for buttom-up proteomics)
Below you can find in silico digests of the whole proteome with Trypsin, Chymotrypsin, Trypsin+LysC, LysN, ArgC proteases suitable for different mass spec machines.| Try ESI |
 |
|---|
| ChTry ESI |
 |
|---|
| ArgC ESI |
 |
|---|
| LysN ESI |
 |
|---|
| TryLysC ESI |
 |
|---|
| Try MALDI |
 |
|---|
| ChTry MALDI |
 |
|---|
| ArgC MALDI |
 |
|---|
| LysN MALDI |
 |
|---|
| TryLysC MALDI |
 |
|---|
| Try LTQ |
 |
|---|
| ChTry LTQ |
 |
|---|
| ArgC LTQ |
 |
|---|
| LysN LTQ |
 |
|---|
| TryLysC LTQ |
 |
|---|
| Try MSlow |
 |
|---|
| ChTry MSlow |
 |
|---|
| ArgC MSlow |
 |
|---|
| LysN MSlow |
 |
|---|
| TryLysC MSlow |
 |
|---|
| Try MShigh |
 |
|---|
| ChTry MShigh |
 |
|---|
| ArgC MShigh |
 |
|---|
| LysN MShigh |
 |
|---|
| TryLysC MShigh |
 |
|---|
General Statistics
Number of major isoforms |
Number of additional isoforms |
Number of all proteins |
Number of amino acids |
Min. Seq. Length |
Max. Seq. Length |
Avg. Seq. Length |
Avg. Mol. Weight |
|---|---|---|---|---|---|---|---|
0 |
1430289 |
27 |
4885 |
321.0 |
34.86 |
Amino acid frequency
Ala |
Cys |
Asp |
Glu |
Phe |
Gly |
His |
Ile |
Lys |
Leu |
|---|---|---|---|---|---|---|---|---|---|
12.16 ± 0.046 | 0.948 ± 0.013 |
5.141 ± 0.034 | 5.324 ± 0.031 |
3.627 ± 0.02 | 8.306 ± 0.034 |
2.322 ± 0.017 | 4.336 ± 0.025 |
3.507 ± 0.033 | 10.668 ± 0.053 |
Met |
Asn |
Gln |
Pro |
Arg |
Ser |
Thr |
Val |
Trp |
Tyr |
|---|---|---|---|---|---|---|---|---|---|
2.756 ± 0.02 | 2.867 ± 0.021 |
5.188 ± 0.031 | 4.093 ± 0.024 |
6.258 ± 0.036 | 5.766 ± 0.031 |
5.325 ± 0.044 | 7.703 ± 0.035 |
1.565 ± 0.018 | 2.14 ± 0.016 |
Most of the basic statistics you can see at this page can be downloaded from this CSV file
Proteome-pI is available under Creative Commons Attribution-NoDerivs license, for more details see here
| Reference: Kozlowski LP. Proteome-pI 2.0: Proteome Isoelectric Point Database Update. Nucleic Acids Res. 2021, doi: 10.1093/nar/gkab944 | Contact: Lukasz P. Kozlowski |
