Varroa mite associated virus 1
Taxonomy: Viruses; unclassified viruses
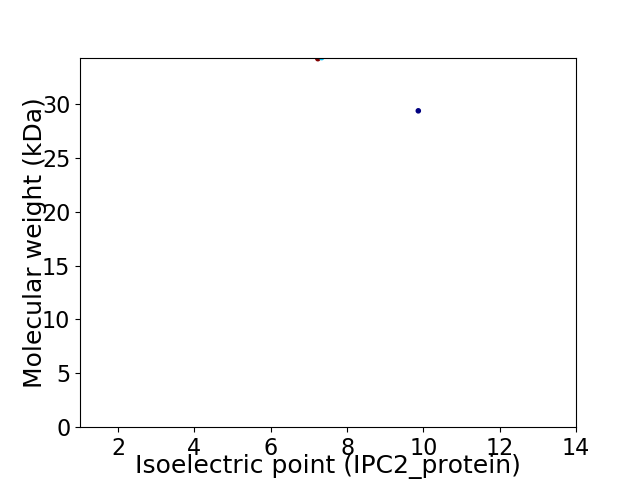
Average proteome isoelectric point is 8.11
Get precalculated fractions of proteins

Virtual 2D-PAGE plot for 2 proteins (isoelectric point calculated using IPC2_protein)
Get csv file with sequences according to given criteria:
* You can choose from 21 different methods for calculating isoelectric point
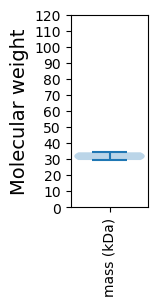
Summary statistics related to proteome-wise predictions


Protein with the lowest isoelectric point:
>tr|A0A2I8B2M4|A0A2I8B2M4_9VIRU ATP-dependent helicase Rep OS=Varroa mite associated virus 1 OX=2077300 PE=3 SV=1
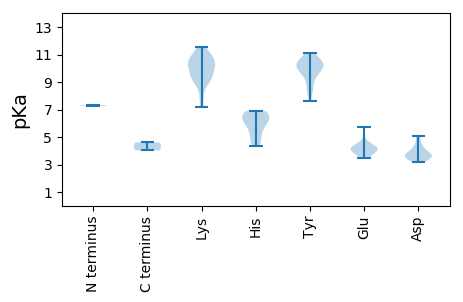
MM1 pKa = 7.33SRR3 pKa = 11.84SKK5 pKa = 10.68NWQFTINNHH14 pKa = 5.27GAVDD18 pKa = 3.78PLLCQWRR25 pKa = 11.84RR26 pKa = 11.84LLEE29 pKa = 3.92QGKK32 pKa = 9.84INYY35 pKa = 7.59LVCQCEE41 pKa = 4.04RR42 pKa = 11.84GDD44 pKa = 3.51NGTPHH49 pKa = 6.16IQGMLQCKK57 pKa = 9.28NAISMQSAKK66 pKa = 10.71DD67 pKa = 3.51RR68 pKa = 11.84ASSNAHH74 pKa = 5.1VEE76 pKa = 3.97VAIRR80 pKa = 11.84PKK82 pKa = 10.15EE83 pKa = 3.74LRR85 pKa = 11.84AYY87 pKa = 10.34CMKK90 pKa = 10.58EE91 pKa = 3.75DD92 pKa = 3.79TRR94 pKa = 11.84EE95 pKa = 4.01LGPWEE100 pKa = 3.71IGEE103 pKa = 4.18FRR105 pKa = 11.84NEE107 pKa = 3.63QGKK110 pKa = 7.73RR111 pKa = 11.84TDD113 pKa = 3.9LDD115 pKa = 3.7LARR118 pKa = 11.84QAIDD122 pKa = 5.06DD123 pKa = 4.34GATDD127 pKa = 3.54AMLAKK132 pKa = 9.89EE133 pKa = 4.16HH134 pKa = 6.69FSTFVKK140 pKa = 9.59YY141 pKa = 10.46HH142 pKa = 6.68KK143 pKa = 10.21GLSAARR149 pKa = 11.84MHH151 pKa = 6.44IQRR154 pKa = 11.84PTNHH158 pKa = 6.89YY159 pKa = 9.21IPKK162 pKa = 9.98KK163 pKa = 9.25VVLFHH168 pKa = 6.56GMPGTGKK175 pKa = 8.97TYY177 pKa = 10.49FCLVTLGLDD186 pKa = 3.46PASVYY191 pKa = 11.12VKK193 pKa = 9.57DD194 pKa = 4.84TRR196 pKa = 11.84TKK198 pKa = 9.0WWDD201 pKa = 3.29GYY203 pKa = 11.07AGQKK207 pKa = 8.8VVVMDD212 pKa = 4.63EE213 pKa = 4.54FPGSLSALDD222 pKa = 3.19WKK224 pKa = 10.99LYY226 pKa = 10.37LGEE229 pKa = 4.56AMVALEE235 pKa = 4.35SKK237 pKa = 10.38GGTMYY242 pKa = 10.69SQYY245 pKa = 9.22EE246 pKa = 4.34TVYY249 pKa = 9.78LTSNYY254 pKa = 10.15AKK256 pKa = 10.76EE257 pKa = 4.15EE258 pKa = 4.11LFPNARR264 pKa = 11.84DD265 pKa = 3.4IDD267 pKa = 3.87RR268 pKa = 11.84QAVQRR273 pKa = 11.84RR274 pKa = 11.84ISEE277 pKa = 4.21SYY279 pKa = 9.63EE280 pKa = 3.44IRR282 pKa = 11.84DD283 pKa = 3.61RR284 pKa = 11.84EE285 pKa = 4.19VDD287 pKa = 4.12FLPFLEE293 pKa = 4.52NYY295 pKa = 8.58VRR297 pKa = 11.84PP298 pKa = 4.03
MM1 pKa = 7.33SRR3 pKa = 11.84SKK5 pKa = 10.68NWQFTINNHH14 pKa = 5.27GAVDD18 pKa = 3.78PLLCQWRR25 pKa = 11.84RR26 pKa = 11.84LLEE29 pKa = 3.92QGKK32 pKa = 9.84INYY35 pKa = 7.59LVCQCEE41 pKa = 4.04RR42 pKa = 11.84GDD44 pKa = 3.51NGTPHH49 pKa = 6.16IQGMLQCKK57 pKa = 9.28NAISMQSAKK66 pKa = 10.71DD67 pKa = 3.51RR68 pKa = 11.84ASSNAHH74 pKa = 5.1VEE76 pKa = 3.97VAIRR80 pKa = 11.84PKK82 pKa = 10.15EE83 pKa = 3.74LRR85 pKa = 11.84AYY87 pKa = 10.34CMKK90 pKa = 10.58EE91 pKa = 3.75DD92 pKa = 3.79TRR94 pKa = 11.84EE95 pKa = 4.01LGPWEE100 pKa = 3.71IGEE103 pKa = 4.18FRR105 pKa = 11.84NEE107 pKa = 3.63QGKK110 pKa = 7.73RR111 pKa = 11.84TDD113 pKa = 3.9LDD115 pKa = 3.7LARR118 pKa = 11.84QAIDD122 pKa = 5.06DD123 pKa = 4.34GATDD127 pKa = 3.54AMLAKK132 pKa = 9.89EE133 pKa = 4.16HH134 pKa = 6.69FSTFVKK140 pKa = 9.59YY141 pKa = 10.46HH142 pKa = 6.68KK143 pKa = 10.21GLSAARR149 pKa = 11.84MHH151 pKa = 6.44IQRR154 pKa = 11.84PTNHH158 pKa = 6.89YY159 pKa = 9.21IPKK162 pKa = 9.98KK163 pKa = 9.25VVLFHH168 pKa = 6.56GMPGTGKK175 pKa = 8.97TYY177 pKa = 10.49FCLVTLGLDD186 pKa = 3.46PASVYY191 pKa = 11.12VKK193 pKa = 9.57DD194 pKa = 4.84TRR196 pKa = 11.84TKK198 pKa = 9.0WWDD201 pKa = 3.29GYY203 pKa = 11.07AGQKK207 pKa = 8.8VVVMDD212 pKa = 4.63EE213 pKa = 4.54FPGSLSALDD222 pKa = 3.19WKK224 pKa = 10.99LYY226 pKa = 10.37LGEE229 pKa = 4.56AMVALEE235 pKa = 4.35SKK237 pKa = 10.38GGTMYY242 pKa = 10.69SQYY245 pKa = 9.22EE246 pKa = 4.34TVYY249 pKa = 9.78LTSNYY254 pKa = 10.15AKK256 pKa = 10.76EE257 pKa = 4.15EE258 pKa = 4.11LFPNARR264 pKa = 11.84DD265 pKa = 3.4IDD267 pKa = 3.87RR268 pKa = 11.84QAVQRR273 pKa = 11.84RR274 pKa = 11.84ISEE277 pKa = 4.21SYY279 pKa = 9.63EE280 pKa = 3.44IRR282 pKa = 11.84DD283 pKa = 3.61RR284 pKa = 11.84EE285 pKa = 4.19VDD287 pKa = 4.12FLPFLEE293 pKa = 4.52NYY295 pKa = 8.58VRR297 pKa = 11.84PP298 pKa = 4.03
Molecular weight: 34.2 kDa
Isoelectric point according different methods:
Protein with the highest isoelectric point:
>tr|A0A2I8B2M4|A0A2I8B2M4_9VIRU ATP-dependent helicase Rep OS=Varroa mite associated virus 1 OX=2077300 PE=3 SV=1
MM1 pKa = 7.27YY2 pKa = 10.15ARR4 pKa = 11.84KK5 pKa = 9.28YY6 pKa = 9.92SYY8 pKa = 10.34RR9 pKa = 11.84RR10 pKa = 11.84RR11 pKa = 11.84PTVRR15 pKa = 11.84RR16 pKa = 11.84YY17 pKa = 8.45GSKK20 pKa = 9.82RR21 pKa = 11.84RR22 pKa = 11.84TYY24 pKa = 10.19GKK26 pKa = 10.35RR27 pKa = 11.84IAKK30 pKa = 9.15LRR32 pKa = 11.84KK33 pKa = 7.21PMRR36 pKa = 11.84RR37 pKa = 11.84AVVHH41 pKa = 4.35VMNRR45 pKa = 11.84RR46 pKa = 11.84VEE48 pKa = 4.16TKK50 pKa = 10.37YY51 pKa = 10.66FYY53 pKa = 9.79STPGPYY59 pKa = 9.91YY60 pKa = 9.51PAPQEE65 pKa = 3.85LWRR68 pKa = 11.84TDD70 pKa = 3.79LLSAIPKK77 pKa = 8.16GTLGSQRR84 pKa = 11.84IGDD87 pKa = 3.84VVNIANVQVKK97 pKa = 9.15YY98 pKa = 10.27QVTITGVTEE107 pKa = 4.19TQGTTTVTTHH117 pKa = 6.69FLNSGGGKK125 pKa = 9.41AAAAPRR131 pKa = 11.84SMLGVLTKK139 pKa = 10.35KK140 pKa = 10.51QIMSFLYY147 pKa = 8.39WQKK150 pKa = 11.45DD151 pKa = 3.61EE152 pKa = 5.76AGTTPVGVSKK162 pKa = 11.53NEE164 pKa = 3.75VFKK167 pKa = 11.1GVSPDD172 pKa = 3.36FVTDD176 pKa = 4.14VIDD179 pKa = 3.72NRR181 pKa = 11.84HH182 pKa = 4.6ITILATRR189 pKa = 11.84KK190 pKa = 9.89HH191 pKa = 5.89VVNPMNVNGAHH202 pKa = 5.94RR203 pKa = 11.84VYY205 pKa = 10.27GTIFKK210 pKa = 11.22SMGQGSNYY218 pKa = 9.93VYY220 pKa = 10.64EE221 pKa = 5.2RR222 pKa = 11.84DD223 pKa = 4.24LGDD226 pKa = 3.71GKK228 pKa = 10.9KK229 pKa = 10.2KK230 pKa = 10.73SLLFGIIVDD239 pKa = 4.32RR240 pKa = 11.84VTTPLDD246 pKa = 3.25VTVLHH251 pKa = 6.16TEE253 pKa = 4.56EE254 pKa = 4.24IRR256 pKa = 11.84FRR258 pKa = 11.84DD259 pKa = 3.43AA260 pKa = 4.6
MM1 pKa = 7.27YY2 pKa = 10.15ARR4 pKa = 11.84KK5 pKa = 9.28YY6 pKa = 9.92SYY8 pKa = 10.34RR9 pKa = 11.84RR10 pKa = 11.84RR11 pKa = 11.84PTVRR15 pKa = 11.84RR16 pKa = 11.84YY17 pKa = 8.45GSKK20 pKa = 9.82RR21 pKa = 11.84RR22 pKa = 11.84TYY24 pKa = 10.19GKK26 pKa = 10.35RR27 pKa = 11.84IAKK30 pKa = 9.15LRR32 pKa = 11.84KK33 pKa = 7.21PMRR36 pKa = 11.84RR37 pKa = 11.84AVVHH41 pKa = 4.35VMNRR45 pKa = 11.84RR46 pKa = 11.84VEE48 pKa = 4.16TKK50 pKa = 10.37YY51 pKa = 10.66FYY53 pKa = 9.79STPGPYY59 pKa = 9.91YY60 pKa = 9.51PAPQEE65 pKa = 3.85LWRR68 pKa = 11.84TDD70 pKa = 3.79LLSAIPKK77 pKa = 8.16GTLGSQRR84 pKa = 11.84IGDD87 pKa = 3.84VVNIANVQVKK97 pKa = 9.15YY98 pKa = 10.27QVTITGVTEE107 pKa = 4.19TQGTTTVTTHH117 pKa = 6.69FLNSGGGKK125 pKa = 9.41AAAAPRR131 pKa = 11.84SMLGVLTKK139 pKa = 10.35KK140 pKa = 10.51QIMSFLYY147 pKa = 8.39WQKK150 pKa = 11.45DD151 pKa = 3.61EE152 pKa = 5.76AGTTPVGVSKK162 pKa = 11.53NEE164 pKa = 3.75VFKK167 pKa = 11.1GVSPDD172 pKa = 3.36FVTDD176 pKa = 4.14VIDD179 pKa = 3.72NRR181 pKa = 11.84HH182 pKa = 4.6ITILATRR189 pKa = 11.84KK190 pKa = 9.89HH191 pKa = 5.89VVNPMNVNGAHH202 pKa = 5.94RR203 pKa = 11.84VYY205 pKa = 10.27GTIFKK210 pKa = 11.22SMGQGSNYY218 pKa = 9.93VYY220 pKa = 10.64EE221 pKa = 5.2RR222 pKa = 11.84DD223 pKa = 4.24LGDD226 pKa = 3.71GKK228 pKa = 10.9KK229 pKa = 10.2KK230 pKa = 10.73SLLFGIIVDD239 pKa = 4.32RR240 pKa = 11.84VTTPLDD246 pKa = 3.25VTVLHH251 pKa = 6.16TEE253 pKa = 4.56EE254 pKa = 4.24IRR256 pKa = 11.84FRR258 pKa = 11.84DD259 pKa = 3.43AA260 pKa = 4.6
Molecular weight: 29.36 kDa
Isoelectric point according different methods:
Peptides (in silico digests for buttom-up proteomics)
Below you can find in silico digests of the whole proteome with Trypsin, Chymotrypsin, Trypsin+LysC, LysN, ArgC proteases suitable for different mass spec machines.| Try ESI |
 |
|---|
| ChTry ESI |
 |
|---|
| ArgC ESI |
 |
|---|
| LysN ESI |
 |
|---|
| TryLysC ESI |
 |
|---|
| Try MALDI |
 |
|---|
| ChTry MALDI |
 |
|---|
| ArgC MALDI |
 |
|---|
| LysN MALDI |
 |
|---|
| TryLysC MALDI |
 |
|---|
| Try LTQ |
 |
|---|
| ChTry LTQ |
 |
|---|
| ArgC LTQ |
 |
|---|
| LysN LTQ |
 |
|---|
| TryLysC LTQ |
 |
|---|
| Try MSlow |
 |
|---|
| ChTry MSlow |
 |
|---|
| ArgC MSlow |
 |
|---|
| LysN MSlow |
 |
|---|
| TryLysC MSlow |
 |
|---|
| Try MShigh |
 |
|---|
| ChTry MShigh |
 |
|---|
| ArgC MShigh |
 |
|---|
| LysN MShigh |
 |
|---|
| TryLysC MShigh |
 |
|---|
General Statistics
Number of major isoforms |
Number of additional isoforms |
Number of all proteins |
Number of amino acids |
Min. Seq. Length |
Max. Seq. Length |
Avg. Seq. Length |
Avg. Mol. Weight |
|---|---|---|---|---|---|---|---|
0 |
558 |
260 |
298 |
279.0 |
31.78 |
Amino acid frequency
Ala |
Cys |
Asp |
Glu |
Phe |
Gly |
His |
Ile |
Lys |
Leu |
|---|---|---|---|---|---|---|---|---|---|
6.452 ± 0.715 | 1.075 ± 0.72 |
5.197 ± 0.647 | 5.018 ± 1.3 |
3.226 ± 0.1 | 7.527 ± 0.626 |
2.509 ± 0.135 | 4.48 ± 0.348 |
6.81 ± 0.333 | 7.168 ± 0.937 |
Met |
Asn |
Gln |
Pro |
Arg |
Ser |
Thr |
Val |
Trp |
Tyr |
|---|---|---|---|---|---|---|---|---|---|
3.047 ± 0.237 | 3.943 ± 0.065 |
4.301 ± 0.211 | 3.943 ± 0.58 |
8.065 ± 0.781 | 5.197 ± 0.132 |
7.348 ± 1.777 | 8.244 ± 1.692 |
1.434 ± 0.445 | 5.018 ± 0.246 |
Most of the basic statistics you can see at this page can be downloaded from this CSV file
Proteome-pI is available under Creative Commons Attribution-NoDerivs license, for more details see here
| Reference: Kozlowski LP. Proteome-pI 2.0: Proteome Isoelectric Point Database Update. Nucleic Acids Res. 2021, doi: 10.1093/nar/gkab944 | Contact: Lukasz P. Kozlowski |
