Human T-cell leukemia virus 1 (strain Japan ATK-1 subtype A) (HTLV-1)
Taxonomy: Viruses; Riboviria; Pararnavirae; Artverviricota; Revtraviricetes; Ortervirales; Retroviridae; Orthoretrovirinae; Deltaretrovirus; Primate T-lymphotropic virus 1; Human T-cell leukemia virus type I; HTLV-1 subtype A
Average proteome isoelectric point is 7.89
Get precalculated fractions of proteins

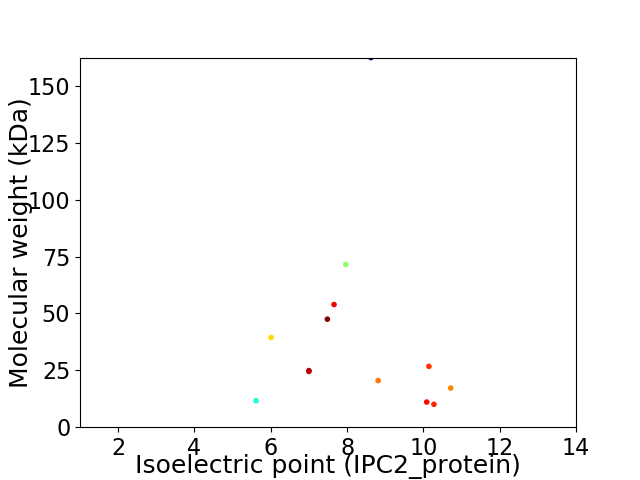
Virtual 2D-PAGE plot for 13 proteins (isoelectric point calculated using IPC2_protein)
Get csv file with sequences according to given criteria:
* You can choose from 21 different methods for calculating isoelectric point
Summary statistics related to proteome-wise predictions


Protein with the lowest isoelectric point:
>sp|P0C214-2|P30II-2_HTL1A Isoform of P0C214 Isoform p13II of Accessory protein p30II OS=Human T-cell leukemia virus 1 (strain Japan ATK-1 subtype A) OX=11926 PE=1 SV=1
MM1 pKa = 8.02DD2 pKa = 5.6ALSAQLYY9 pKa = 10.43SSLSLDD15 pKa = 4.19SPPSPPRR22 pKa = 11.84EE23 pKa = 3.79PLRR26 pKa = 11.84PSRR29 pKa = 11.84SLPRR33 pKa = 11.84QSLIQPPTFHH43 pKa = 7.19PPSSRR48 pKa = 11.84PCANTPPSEE57 pKa = 4.03MDD59 pKa = 2.87TWNPPLGSTSQPCLFQTPDD78 pKa = 3.97SGPKK82 pKa = 8.26TCTPSGEE89 pKa = 4.42APLSACTSTSFPPPSPGPSCPTT111 pKa = 3.33
MM1 pKa = 8.02DD2 pKa = 5.6ALSAQLYY9 pKa = 10.43SSLSLDD15 pKa = 4.19SPPSPPRR22 pKa = 11.84EE23 pKa = 3.79PLRR26 pKa = 11.84PSRR29 pKa = 11.84SLPRR33 pKa = 11.84QSLIQPPTFHH43 pKa = 7.19PPSSRR48 pKa = 11.84PCANTPPSEE57 pKa = 4.03MDD59 pKa = 2.87TWNPPLGSTSQPCLFQTPDD78 pKa = 3.97SGPKK82 pKa = 8.26TCTPSGEE89 pKa = 4.42APLSACTSTSFPPPSPGPSCPTT111 pKa = 3.33
Molecular weight: 11.64 kDa
Isoelectric point according different methods:
Protein with the highest isoelectric point:
>sp|P0C746-2|HBZ-2_HTL1A Isoform of P0C746 Isoform HBZ-SI of HTLV-1 basic zipper factor OS=Human T-cell leukemia virus 1 (strain Japan ATK-1 subtype A) OX=11926 GN=HBZ PE=1 SV=1
MM1 pKa = 7.78PKK3 pKa = 8.91TRR5 pKa = 11.84RR6 pKa = 11.84RR7 pKa = 11.84PRR9 pKa = 11.84RR10 pKa = 11.84SQRR13 pKa = 11.84KK14 pKa = 8.69RR15 pKa = 11.84PPTPWQLPPFSLQGLHH31 pKa = 6.98LAFQLSSIAINPQLLHH47 pKa = 6.47FFFPSTLFRR56 pKa = 11.84LLSPLSPLALTALLLFLLPPSDD78 pKa = 3.79VSGLLLRR85 pKa = 11.84PPPAPCLLLFLPFQILSGLLFLLFLPLFFSLPLLLSPSLPITMRR129 pKa = 11.84FPARR133 pKa = 11.84WRR135 pKa = 11.84FLPWKK140 pKa = 10.28APSQPAAAFLFF151 pKa = 4.4
MM1 pKa = 7.78PKK3 pKa = 8.91TRR5 pKa = 11.84RR6 pKa = 11.84RR7 pKa = 11.84PRR9 pKa = 11.84RR10 pKa = 11.84SQRR13 pKa = 11.84KK14 pKa = 8.69RR15 pKa = 11.84PPTPWQLPPFSLQGLHH31 pKa = 6.98LAFQLSSIAINPQLLHH47 pKa = 6.47FFFPSTLFRR56 pKa = 11.84LLSPLSPLALTALLLFLLPPSDD78 pKa = 3.79VSGLLLRR85 pKa = 11.84PPPAPCLLLFLPFQILSGLLFLLFLPLFFSLPLLLSPSLPITMRR129 pKa = 11.84FPARR133 pKa = 11.84WRR135 pKa = 11.84FLPWKK140 pKa = 10.28APSQPAAAFLFF151 pKa = 4.4
Molecular weight: 17.2 kDa
Isoelectric point according different methods:
Peptides (in silico digests for buttom-up proteomics)
Below you can find in silico digests of the whole proteome with Trypsin, Chymotrypsin, Trypsin+LysC, LysN, ArgC proteases suitable for different mass spec machines.| Try ESI |
 |
|---|
| ChTry ESI |
 |
|---|
| ArgC ESI |
 |
|---|
| LysN ESI |
 |
|---|
| TryLysC ESI |
 |
|---|
| Try MALDI |
 |
|---|
| ChTry MALDI |
 |
|---|
| ArgC MALDI |
 |
|---|
| LysN MALDI |
 |
|---|
| TryLysC MALDI |
 |
|---|
| Try LTQ |
 |
|---|
| ChTry LTQ |
 |
|---|
| ArgC LTQ |
 |
|---|
| LysN LTQ |
 |
|---|
| TryLysC LTQ |
 |
|---|
| Try MSlow |
 |
|---|
| ChTry MSlow |
 |
|---|
| ArgC MSlow |
 |
|---|
| LysN MSlow |
 |
|---|
| TryLysC MSlow |
 |
|---|
| Try MShigh |
 |
|---|
| ChTry MShigh |
 |
|---|
| ArgC MShigh |
 |
|---|
| LysN MShigh |
 |
|---|
| TryLysC MShigh |
 |
|---|
General Statistics
Number of major isoforms |
Number of additional isoforms |
Number of all proteins |
Number of amino acids |
Min. Seq. Length |
Max. Seq. Length |
Avg. Seq. Length |
Avg. Mol. Weight |
|---|---|---|---|---|---|---|---|
4676 |
87 |
1462 |
359.7 |
40.12 |
Amino acid frequency
Ala |
Cys |
Asp |
Glu |
Phe |
Gly |
His |
Ile |
Lys |
Leu |
|---|---|---|---|---|---|---|---|---|---|
6.779 ± 0.479 | 2.203 ± 0.256 |
3.507 ± 0.26 | 4.32 ± 1.606 |
3.464 ± 0.62 | 5.047 ± 0.244 |
3.165 ± 0.441 | 4.021 ± 0.621 |
4.085 ± 0.605 | 13.238 ± 0.84 |
Met |
Asn |
Gln |
Pro |
Arg |
Ser |
Thr |
Val |
Trp |
Tyr |
|---|---|---|---|---|---|---|---|---|---|
1.198 ± 0.148 | 2.823 ± 0.452 |
11.976 ± 1.024 | 5.945 ± 0.735 |
6.287 ± 1.188 | 8.618 ± 1.164 |
5.774 ± 0.59 | 3.486 ± 0.307 |
1.818 ± 0.127 | 2.246 ± 0.295 |
Most of the basic statistics you can see at this page can be downloaded from this CSV file
Proteome-pI is available under Creative Commons Attribution-NoDerivs license, for more details see here
| Reference: Kozlowski LP. Proteome-pI 2.0: Proteome Isoelectric Point Database Update. Nucleic Acids Res. 2021, doi: 10.1093/nar/gkab944 | Contact: Lukasz P. Kozlowski |
