Shewanella frigidimarina (strain NCIMB 400)
Taxonomy: cellular organisms; Bacteria; Proteobacteria; Gammaproteobacteria; Alteromonadales; Shewanellaceae; Shewanella; Shewanella frigidimarina
Average proteome isoelectric point is 6.11
Get precalculated fractions of proteins

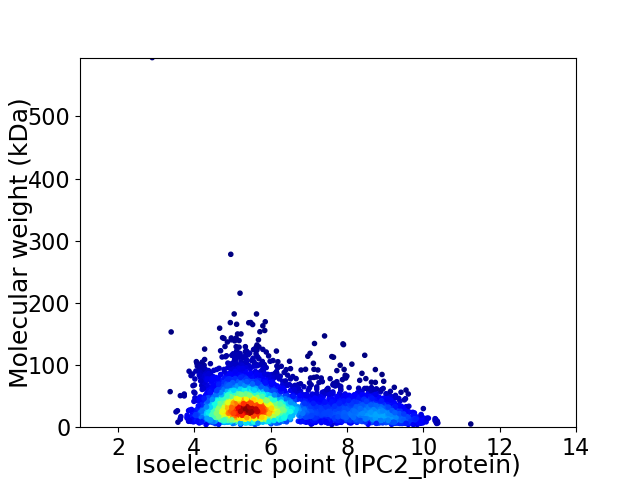
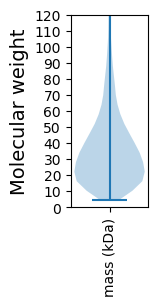
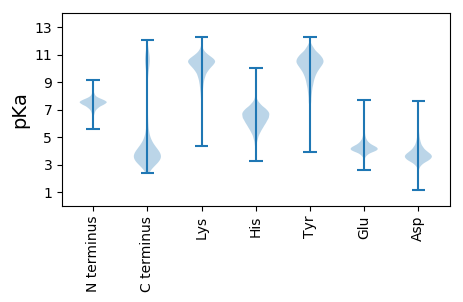
Virtual 2D-PAGE plot for 3990 proteins (isoelectric point calculated using IPC2_protein)
Get csv file with sequences according to given criteria:
* You can choose from 21 different methods for calculating isoelectric point
Summary statistics related to proteome-wise predictions


Protein with the lowest isoelectric point:
>tr|Q086I6|Q086I6_SHEFN Carbamoyl-phosphate synthase large chain OS=Shewanella frigidimarina (strain NCIMB 400) OX=318167 GN=carB PE=3 SV=1
MM1 pKa = 7.16HH2 pKa = 7.12TTNKK6 pKa = 10.26YY7 pKa = 9.49YY8 pKa = 10.77NQTILASSILMASLISGCNNDD29 pKa = 5.97DD30 pKa = 3.95NDD32 pKa = 3.86NDD34 pKa = 3.61NAATVPVINASNPINLAIDD53 pKa = 3.43VAINQQITATFSDD66 pKa = 3.64AMNEE70 pKa = 3.87QTINDD75 pKa = 3.47ASFTLTAPSQTAVLGTVSYY94 pKa = 11.51DD95 pKa = 3.78EE96 pKa = 4.6TSHH99 pKa = 5.91TAVFAPSSDD108 pKa = 3.53FTHH111 pKa = 5.71NTLYY115 pKa = 10.28QASITTEE122 pKa = 3.9VTNTAGIALASGFSWSFTTSALPDD146 pKa = 3.59VIAPQVVSNYY156 pKa = 9.88PVDD159 pKa = 4.02LAQDD163 pKa = 3.94FALNRR168 pKa = 11.84NMTAEE173 pKa = 4.14FSEE176 pKa = 4.4ALSPNTVNGSSFTLSDD192 pKa = 3.26GTNLVTGVVSVQGTVATFNPDD213 pKa = 3.28DD214 pKa = 3.93NLAANTLYY222 pKa = 10.31TATLTTAISDD232 pKa = 3.9LAIPANLLAASFSWSFTTSDD252 pKa = 3.11VAAIGPEE259 pKa = 4.04PVKK262 pKa = 10.81LRR264 pKa = 11.84TSGDD268 pKa = 3.36FAILTKK274 pKa = 10.49TGITNIPASAITGNIGSSPITAAAMDD300 pKa = 3.77NVFCNEE306 pKa = 3.53ISGTIYY312 pKa = 10.68GADD315 pKa = 3.23AAYY318 pKa = 8.74TGSGAITCFAGAAEE332 pKa = 4.81DD333 pKa = 3.72NTLVANAVLDD343 pKa = 3.43MGTAYY348 pKa = 10.99NDD350 pKa = 3.47AAGRR354 pKa = 11.84TLPDD358 pKa = 3.42YY359 pKa = 10.72TEE361 pKa = 5.19LGAGDD366 pKa = 3.67ISGMTLEE373 pKa = 4.76PGLYY377 pKa = 8.71KK378 pKa = 10.31WSSGVLISTDD388 pKa = 3.17VTLSGSANDD397 pKa = 3.16VWIFQIAGDD406 pKa = 4.29LTQAAASRR414 pKa = 11.84INLQSGAQAKK424 pKa = 10.31NIFWQVGGSAGVALDD439 pKa = 3.74TTAHH443 pKa = 6.06FEE445 pKa = 4.24GVILAEE451 pKa = 4.45KK452 pKa = 9.92GISINTDD459 pKa = 2.42ATVNGRR465 pKa = 11.84LMSQTAVTLDD475 pKa = 3.79HH476 pKa = 7.12NIVTQPTEE484 pKa = 3.67QFF486 pKa = 3.29
MM1 pKa = 7.16HH2 pKa = 7.12TTNKK6 pKa = 10.26YY7 pKa = 9.49YY8 pKa = 10.77NQTILASSILMASLISGCNNDD29 pKa = 5.97DD30 pKa = 3.95NDD32 pKa = 3.86NDD34 pKa = 3.61NAATVPVINASNPINLAIDD53 pKa = 3.43VAINQQITATFSDD66 pKa = 3.64AMNEE70 pKa = 3.87QTINDD75 pKa = 3.47ASFTLTAPSQTAVLGTVSYY94 pKa = 11.51DD95 pKa = 3.78EE96 pKa = 4.6TSHH99 pKa = 5.91TAVFAPSSDD108 pKa = 3.53FTHH111 pKa = 5.71NTLYY115 pKa = 10.28QASITTEE122 pKa = 3.9VTNTAGIALASGFSWSFTTSALPDD146 pKa = 3.59VIAPQVVSNYY156 pKa = 9.88PVDD159 pKa = 4.02LAQDD163 pKa = 3.94FALNRR168 pKa = 11.84NMTAEE173 pKa = 4.14FSEE176 pKa = 4.4ALSPNTVNGSSFTLSDD192 pKa = 3.26GTNLVTGVVSVQGTVATFNPDD213 pKa = 3.28DD214 pKa = 3.93NLAANTLYY222 pKa = 10.31TATLTTAISDD232 pKa = 3.9LAIPANLLAASFSWSFTTSDD252 pKa = 3.11VAAIGPEE259 pKa = 4.04PVKK262 pKa = 10.81LRR264 pKa = 11.84TSGDD268 pKa = 3.36FAILTKK274 pKa = 10.49TGITNIPASAITGNIGSSPITAAAMDD300 pKa = 3.77NVFCNEE306 pKa = 3.53ISGTIYY312 pKa = 10.68GADD315 pKa = 3.23AAYY318 pKa = 8.74TGSGAITCFAGAAEE332 pKa = 4.81DD333 pKa = 3.72NTLVANAVLDD343 pKa = 3.43MGTAYY348 pKa = 10.99NDD350 pKa = 3.47AAGRR354 pKa = 11.84TLPDD358 pKa = 3.42YY359 pKa = 10.72TEE361 pKa = 5.19LGAGDD366 pKa = 3.67ISGMTLEE373 pKa = 4.76PGLYY377 pKa = 8.71KK378 pKa = 10.31WSSGVLISTDD388 pKa = 3.17VTLSGSANDD397 pKa = 3.16VWIFQIAGDD406 pKa = 4.29LTQAAASRR414 pKa = 11.84INLQSGAQAKK424 pKa = 10.31NIFWQVGGSAGVALDD439 pKa = 3.74TTAHH443 pKa = 6.06FEE445 pKa = 4.24GVILAEE451 pKa = 4.45KK452 pKa = 9.92GISINTDD459 pKa = 2.42ATVNGRR465 pKa = 11.84LMSQTAVTLDD475 pKa = 3.79HH476 pKa = 7.12NIVTQPTEE484 pKa = 3.67QFF486 pKa = 3.29
Molecular weight: 50.31 kDa
Isoelectric point according different methods:
Protein with the highest isoelectric point:
>tr|Q07VT7|Q07VT7_SHEFN ATP synthase I chain OS=Shewanella frigidimarina (strain NCIMB 400) OX=318167 GN=Sfri_4052 PE=4 SV=1
MM1 pKa = 7.69SKK3 pKa = 9.01RR4 pKa = 11.84TFQPSNLKK12 pKa = 10.14RR13 pKa = 11.84KK14 pKa = 9.13RR15 pKa = 11.84SHH17 pKa = 6.17GFRR20 pKa = 11.84ARR22 pKa = 11.84MATVGGRR29 pKa = 11.84KK30 pKa = 9.01VLARR34 pKa = 11.84RR35 pKa = 11.84RR36 pKa = 11.84AKK38 pKa = 10.39GRR40 pKa = 11.84ARR42 pKa = 11.84LSAA45 pKa = 3.91
MM1 pKa = 7.69SKK3 pKa = 9.01RR4 pKa = 11.84TFQPSNLKK12 pKa = 10.14RR13 pKa = 11.84KK14 pKa = 9.13RR15 pKa = 11.84SHH17 pKa = 6.17GFRR20 pKa = 11.84ARR22 pKa = 11.84MATVGGRR29 pKa = 11.84KK30 pKa = 9.01VLARR34 pKa = 11.84RR35 pKa = 11.84RR36 pKa = 11.84AKK38 pKa = 10.39GRR40 pKa = 11.84ARR42 pKa = 11.84LSAA45 pKa = 3.91
Molecular weight: 5.15 kDa
Isoelectric point according different methods:
Peptides (in silico digests for buttom-up proteomics)
Below you can find in silico digests of the whole proteome with Trypsin, Chymotrypsin, Trypsin+LysC, LysN, ArgC proteases suitable for different mass spec machines.| Try ESI |
 |
|---|
| ChTry ESI |
 |
|---|
| ArgC ESI |
 |
|---|
| LysN ESI |
 |
|---|
| TryLysC ESI |
 |
|---|
| Try MALDI |
 |
|---|
| ChTry MALDI |
 |
|---|
| ArgC MALDI |
 |
|---|
| LysN MALDI |
 |
|---|
| TryLysC MALDI |
 |
|---|
| Try LTQ |
 |
|---|
| ChTry LTQ |
 |
|---|
| ArgC LTQ |
 |
|---|
| LysN LTQ |
 |
|---|
| TryLysC LTQ |
 |
|---|
| Try MSlow |
 |
|---|
| ChTry MSlow |
 |
|---|
| ArgC MSlow |
 |
|---|
| LysN MSlow |
 |
|---|
| TryLysC MSlow |
 |
|---|
| Try MShigh |
 |
|---|
| ChTry MShigh |
 |
|---|
| ArgC MShigh |
 |
|---|
| LysN MShigh |
 |
|---|
| TryLysC MShigh |
 |
|---|
General Statistics
Number of major isoforms |
Number of additional isoforms |
Number of all proteins |
Number of amino acids |
Min. Seq. Length |
Max. Seq. Length |
Avg. Seq. Length |
Avg. Mol. Weight |
|---|---|---|---|---|---|---|---|
0 |
1345936 |
36 |
5787 |
337.3 |
37.36 |
Amino acid frequency
Ala |
Cys |
Asp |
Glu |
Phe |
Gly |
His |
Ile |
Lys |
Leu |
|---|---|---|---|---|---|---|---|---|---|
8.94 ± 0.045 | 1.034 ± 0.015 |
5.692 ± 0.042 | 5.459 ± 0.031 |
4.07 ± 0.027 | 6.635 ± 0.038 |
2.297 ± 0.021 | 6.67 ± 0.035 |
5.075 ± 0.036 | 10.484 ± 0.052 |
Met |
Asn |
Gln |
Pro |
Arg |
Ser |
Thr |
Val |
Trp |
Tyr |
|---|---|---|---|---|---|---|---|---|---|
2.677 ± 0.023 | 4.485 ± 0.029 |
3.856 ± 0.023 | 4.989 ± 0.045 |
4.216 ± 0.036 | 6.739 ± 0.032 |
5.576 ± 0.036 | 6.895 ± 0.034 |
1.18 ± 0.016 | 3.031 ± 0.021 |
Most of the basic statistics you can see at this page can be downloaded from this CSV file
Proteome-pI is available under Creative Commons Attribution-NoDerivs license, for more details see here
| Reference: Kozlowski LP. Proteome-pI 2.0: Proteome Isoelectric Point Database Update. Nucleic Acids Res. 2021, doi: 10.1093/nar/gkab944 | Contact: Lukasz P. Kozlowski |
