Tilletia controversa (dwarf bunt fungus)
Taxonomy: cellular organisms; Eukaryota; Opisthokonta; Fungi; Dikarya; Basidiomycota; Ustilaginomycotina; Exobasidiomycetes; Tilletiales; Tilletiaceae; Tilletia
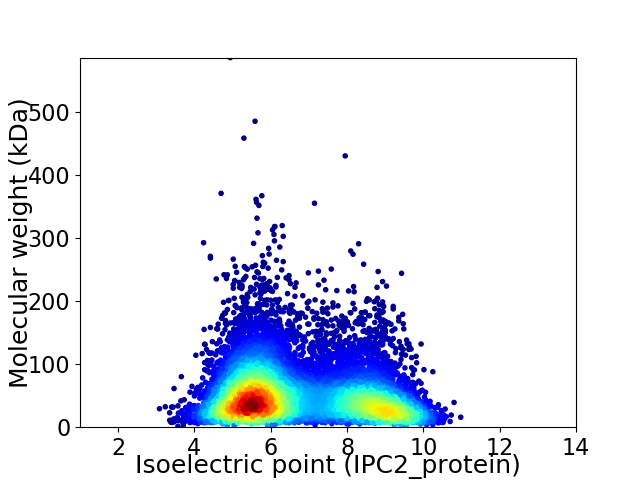
Average proteome isoelectric point is 6.76
Get precalculated fractions of proteins

Virtual 2D-PAGE plot for 9854 proteins (isoelectric point calculated using IPC2_protein)
Get csv file with sequences according to given criteria:
* You can choose from 21 different methods for calculating isoelectric point
Summary statistics related to proteome-wise predictions


Protein with the lowest isoelectric point:
>tr|A0A177VU25|A0A177VU25_9BASI DUF155 domain-containing protein OS=Tilletia controversa OX=13291 GN=A4X06_g1366 PE=3 SV=1
MM1 pKa = 7.37LHH3 pKa = 6.79HH4 pKa = 6.93SLLAATILATTASYY18 pKa = 11.31ALPAQGDD25 pKa = 3.74MSFLSSTSEE34 pKa = 3.89LLFSRR39 pKa = 11.84TEE41 pKa = 3.93NGTSATEE48 pKa = 3.62ICADD52 pKa = 3.76GNQLVYY58 pKa = 10.39TPSTNGGPGSPQQIILSKK76 pKa = 10.41LYY78 pKa = 9.82QQAGVLTNVKK88 pKa = 9.64IDD90 pKa = 3.65FTEE93 pKa = 4.09ALAVSAGSVALNCQVASGTADD114 pKa = 3.33LTQDD118 pKa = 3.13QKK120 pKa = 11.81LSVILPIICAPVTAANPAPGIVGTGTGTGSAPAPADD156 pKa = 3.34PAAPAPAAPTDD167 pKa = 3.94PAAAPADD174 pKa = 4.23PNAAPADD181 pKa = 4.11PNAAPADD188 pKa = 4.11PNAAPADD195 pKa = 4.11PNAAPADD202 pKa = 3.86PATPGAAGDD211 pKa = 4.0AGTGTGTGTGTGDD224 pKa = 3.53GTDD227 pKa = 3.41KK228 pKa = 11.4GVGAGDD234 pKa = 3.81AGSGTGTGDD243 pKa = 3.23STGTGTGDD251 pKa = 3.15GTGAGSGTGAGGTGNGDD268 pKa = 3.44GTGTATGTGTGSGTGNGDD286 pKa = 3.32GTGTGAGGNGSGTGDD301 pKa = 3.63GGNGTPATGGDD312 pKa = 3.64GSNGVAGAAGNNGNGNANGTSNSGTGQRR340 pKa = 11.84AAGGSVGPITASTSMFTIVVAGAAYY365 pKa = 8.52TLLMLL370 pKa = 5.52
MM1 pKa = 7.37LHH3 pKa = 6.79HH4 pKa = 6.93SLLAATILATTASYY18 pKa = 11.31ALPAQGDD25 pKa = 3.74MSFLSSTSEE34 pKa = 3.89LLFSRR39 pKa = 11.84TEE41 pKa = 3.93NGTSATEE48 pKa = 3.62ICADD52 pKa = 3.76GNQLVYY58 pKa = 10.39TPSTNGGPGSPQQIILSKK76 pKa = 10.41LYY78 pKa = 9.82QQAGVLTNVKK88 pKa = 9.64IDD90 pKa = 3.65FTEE93 pKa = 4.09ALAVSAGSVALNCQVASGTADD114 pKa = 3.33LTQDD118 pKa = 3.13QKK120 pKa = 11.81LSVILPIICAPVTAANPAPGIVGTGTGTGSAPAPADD156 pKa = 3.34PAAPAPAAPTDD167 pKa = 3.94PAAAPADD174 pKa = 4.23PNAAPADD181 pKa = 4.11PNAAPADD188 pKa = 4.11PNAAPADD195 pKa = 4.11PNAAPADD202 pKa = 3.86PATPGAAGDD211 pKa = 4.0AGTGTGTGTGTGDD224 pKa = 3.53GTDD227 pKa = 3.41KK228 pKa = 11.4GVGAGDD234 pKa = 3.81AGSGTGTGDD243 pKa = 3.23STGTGTGDD251 pKa = 3.15GTGAGSGTGAGGTGNGDD268 pKa = 3.44GTGTATGTGTGSGTGNGDD286 pKa = 3.32GTGTGAGGNGSGTGDD301 pKa = 3.63GGNGTPATGGDD312 pKa = 3.64GSNGVAGAAGNNGNGNANGTSNSGTGQRR340 pKa = 11.84AAGGSVGPITASTSMFTIVVAGAAYY365 pKa = 8.52TLLMLL370 pKa = 5.52
Molecular weight: 33.83 kDa
Isoelectric point according different methods:
Protein with the highest isoelectric point:
>tr|A0A177VLU4|A0A177VLU4_9BASI USP domain-containing protein OS=Tilletia controversa OX=13291 GN=A4X06_g4269 PE=4 SV=1
MM1 pKa = 7.39SVLNSRR7 pKa = 11.84ILATAARR14 pKa = 11.84ATASAVAARR23 pKa = 11.84APTALTTLARR33 pKa = 11.84RR34 pKa = 11.84QAASPSRR41 pKa = 11.84SLSTSRR47 pKa = 11.84TRR49 pKa = 11.84PNTRR53 pKa = 11.84CTSATPLIPTGSGSASFCSAAVRR76 pKa = 11.84SGASGSHH83 pKa = 6.27GGGKK87 pKa = 10.28LKK89 pKa = 9.21THH91 pKa = 6.87MGTKK95 pKa = 9.91KK96 pKa = 10.18RR97 pKa = 11.84FFPVGSIVGMFKK109 pKa = 10.4RR110 pKa = 11.84GRR112 pKa = 11.84AGKK115 pKa = 9.42SHH117 pKa = 7.01LNSHH121 pKa = 6.35MSSVRR126 pKa = 11.84RR127 pKa = 11.84SRR129 pKa = 11.84LRR131 pKa = 11.84GMAITPPGQTARR143 pKa = 11.84HH144 pKa = 6.29LKK146 pKa = 10.33RR147 pKa = 11.84LLGPILL153 pKa = 3.78
MM1 pKa = 7.39SVLNSRR7 pKa = 11.84ILATAARR14 pKa = 11.84ATASAVAARR23 pKa = 11.84APTALTTLARR33 pKa = 11.84RR34 pKa = 11.84QAASPSRR41 pKa = 11.84SLSTSRR47 pKa = 11.84TRR49 pKa = 11.84PNTRR53 pKa = 11.84CTSATPLIPTGSGSASFCSAAVRR76 pKa = 11.84SGASGSHH83 pKa = 6.27GGGKK87 pKa = 10.28LKK89 pKa = 9.21THH91 pKa = 6.87MGTKK95 pKa = 9.91KK96 pKa = 10.18RR97 pKa = 11.84FFPVGSIVGMFKK109 pKa = 10.4RR110 pKa = 11.84GRR112 pKa = 11.84AGKK115 pKa = 9.42SHH117 pKa = 7.01LNSHH121 pKa = 6.35MSSVRR126 pKa = 11.84RR127 pKa = 11.84SRR129 pKa = 11.84LRR131 pKa = 11.84GMAITPPGQTARR143 pKa = 11.84HH144 pKa = 6.29LKK146 pKa = 10.33RR147 pKa = 11.84LLGPILL153 pKa = 3.78
Molecular weight: 15.9 kDa
Isoelectric point according different methods:
Peptides (in silico digests for buttom-up proteomics)
Below you can find in silico digests of the whole proteome with Trypsin, Chymotrypsin, Trypsin+LysC, LysN, ArgC proteases suitable for different mass spec machines.| Try ESI |
 |
|---|
| ChTry ESI |
 |
|---|
| ArgC ESI |
 |
|---|
| LysN ESI |
 |
|---|
| TryLysC ESI |
 |
|---|
| Try MALDI |
 |
|---|
| ChTry MALDI |
 |
|---|
| ArgC MALDI |
 |
|---|
| LysN MALDI |
 |
|---|
| TryLysC MALDI |
 |
|---|
| Try LTQ |
 |
|---|
| ChTry LTQ |
 |
|---|
| ArgC LTQ |
 |
|---|
| LysN LTQ |
 |
|---|
| TryLysC LTQ |
 |
|---|
| Try MSlow |
 |
|---|
| ChTry MSlow |
 |
|---|
| ArgC MSlow |
 |
|---|
| LysN MSlow |
 |
|---|
| TryLysC MSlow |
 |
|---|
| Try MShigh |
 |
|---|
| ChTry MShigh |
 |
|---|
| ArgC MShigh |
 |
|---|
| LysN MShigh |
 |
|---|
| TryLysC MShigh |
 |
|---|
General Statistics
Number of major isoforms |
Number of additional isoforms |
Number of all proteins |
Number of amino acids |
Min. Seq. Length |
Max. Seq. Length |
Avg. Seq. Length |
Avg. Mol. Weight |
|---|---|---|---|---|---|---|---|
0 |
5235128 |
9 |
5359 |
531.3 |
57.4 |
Amino acid frequency
Ala |
Cys |
Asp |
Glu |
Phe |
Gly |
His |
Ile |
Lys |
Leu |
|---|---|---|---|---|---|---|---|---|---|
10.969 ± 0.028 | 0.942 ± 0.008 |
5.608 ± 0.019 | 5.691 ± 0.025 |
3.142 ± 0.012 | 7.779 ± 0.031 |
2.491 ± 0.013 | 3.829 ± 0.014 |
4.014 ± 0.021 | 8.635 ± 0.027 |
Met |
Asn |
Gln |
Pro |
Arg |
Ser |
Thr |
Val |
Trp |
Tyr |
|---|---|---|---|---|---|---|---|---|---|
1.868 ± 0.009 | 3.063 ± 0.013 |
6.547 ± 0.025 | 4.185 ± 0.021 |
6.636 ± 0.02 | 9.59 ± 0.038 |
5.961 ± 0.018 | 5.822 ± 0.017 |
1.183 ± 0.007 | 2.044 ± 0.01 |
Most of the basic statistics you can see at this page can be downloaded from this CSV file
Proteome-pI is available under Creative Commons Attribution-NoDerivs license, for more details see here
| Reference: Kozlowski LP. Proteome-pI 2.0: Proteome Isoelectric Point Database Update. Nucleic Acids Res. 2021, doi: 10.1093/nar/gkab944 | Contact: Lukasz P. Kozlowski |
