Pebjah virus
Taxonomy: Viruses; Riboviria; Orthornavirae; Pisuviricota; Pisoniviricetes; Nidovirales; Arnidovirineae; Arteriviridae; Simarterivirinae; Iotaarterivirus; Pedartevirus; Deltaarterivirus pejah
Average proteome isoelectric point is 7.43
Get precalculated fractions of proteins

Virtual 2D-PAGE plot for 15 proteins (isoelectric point calculated using IPC2_protein)
Get csv file with sequences according to given criteria:
* You can choose from 21 different methods for calculating isoelectric point
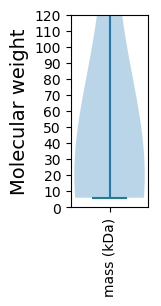
Summary statistics related to proteome-wise predictions


Protein with the lowest isoelectric point:
>tr|A0A0G2UIN6|A0A0G2UIN6_9NIDO Non-structural protein 3 OS=Pebjah virus OX=1658615 GN=ORF1a PE=4 SV=1
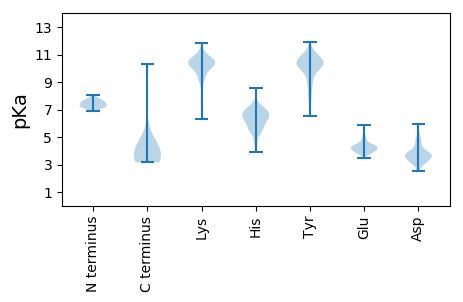
MM1 pKa = 7.2EE2 pKa = 4.98HH3 pKa = 6.33QVPLCLSVCLILCNCFHH20 pKa = 7.14LLWASDD26 pKa = 3.39NSSNSSSPSVCFRR39 pKa = 11.84FPRR42 pKa = 11.84LKK44 pKa = 10.5SVNFSIILRR53 pKa = 11.84AHH55 pKa = 5.56VCNLNDD61 pKa = 4.13SGILYY66 pKa = 10.53YY67 pKa = 9.3EE68 pKa = 4.38TQTHH72 pKa = 6.19SVGQSNSEE80 pKa = 4.01GGAKK84 pKa = 10.21CADD87 pKa = 3.67FSSDD91 pKa = 2.96GRR93 pKa = 11.84RR94 pKa = 11.84EE95 pKa = 3.92AARR98 pKa = 11.84HH99 pKa = 4.87GFGNVWVVPRR109 pKa = 11.84TVNTTFNFSDD119 pKa = 3.6QVGHH123 pKa = 6.41QGHH126 pKa = 5.15THH128 pKa = 5.94IAALLVYY135 pKa = 10.04LLSYY139 pKa = 9.13YY140 pKa = 10.03PRR142 pKa = 11.84VFNFTGNVTRR152 pKa = 11.84GYY154 pKa = 11.14YY155 pKa = 10.15LVEE158 pKa = 5.37DD159 pKa = 3.85DD160 pKa = 5.23TYY162 pKa = 11.79TSICVNGTVTPQEE175 pKa = 4.09RR176 pKa = 11.84MGLLALGVEE185 pKa = 4.98QEE187 pKa = 4.72IEE189 pKa = 3.73WATYY193 pKa = 9.67FPEE196 pKa = 4.28LLRR199 pKa = 11.84PFIFSVLLLAAAEE212 pKa = 4.13LL213 pKa = 4.03
MM1 pKa = 7.2EE2 pKa = 4.98HH3 pKa = 6.33QVPLCLSVCLILCNCFHH20 pKa = 7.14LLWASDD26 pKa = 3.39NSSNSSSPSVCFRR39 pKa = 11.84FPRR42 pKa = 11.84LKK44 pKa = 10.5SVNFSIILRR53 pKa = 11.84AHH55 pKa = 5.56VCNLNDD61 pKa = 4.13SGILYY66 pKa = 10.53YY67 pKa = 9.3EE68 pKa = 4.38TQTHH72 pKa = 6.19SVGQSNSEE80 pKa = 4.01GGAKK84 pKa = 10.21CADD87 pKa = 3.67FSSDD91 pKa = 2.96GRR93 pKa = 11.84RR94 pKa = 11.84EE95 pKa = 3.92AARR98 pKa = 11.84HH99 pKa = 4.87GFGNVWVVPRR109 pKa = 11.84TVNTTFNFSDD119 pKa = 3.6QVGHH123 pKa = 6.41QGHH126 pKa = 5.15THH128 pKa = 5.94IAALLVYY135 pKa = 10.04LLSYY139 pKa = 9.13YY140 pKa = 10.03PRR142 pKa = 11.84VFNFTGNVTRR152 pKa = 11.84GYY154 pKa = 11.14YY155 pKa = 10.15LVEE158 pKa = 5.37DD159 pKa = 3.85DD160 pKa = 5.23TYY162 pKa = 11.79TSICVNGTVTPQEE175 pKa = 4.09RR176 pKa = 11.84MGLLALGVEE185 pKa = 4.98QEE187 pKa = 4.72IEE189 pKa = 3.73WATYY193 pKa = 9.67FPEE196 pKa = 4.28LLRR199 pKa = 11.84PFIFSVLLLAAAEE212 pKa = 4.13LL213 pKa = 4.03
Molecular weight: 23.78 kDa
Isoelectric point according different methods:
Protein with the highest isoelectric point:
>tr|A0A0G2UPU7|A0A0G2UPU7_9NIDO E protein OS=Pebjah virus OX=1658615 GN=ORF2a PE=4 SV=1
MM1 pKa = 6.87VAKK4 pKa = 10.15ICSDD8 pKa = 3.37PGYY11 pKa = 6.67TTLAFTCAPVIIACLRR27 pKa = 11.84LFRR30 pKa = 11.84PALRR34 pKa = 11.84GFICAICIAILAYY47 pKa = 10.22AATAFSTHH55 pKa = 5.35SFATIVTLGFSLLYY69 pKa = 10.24LAYY72 pKa = 9.7KK73 pKa = 9.85LLQWAIIRR81 pKa = 11.84CRR83 pKa = 11.84MCRR86 pKa = 11.84LGRR89 pKa = 11.84GYY91 pKa = 8.39ITAPSSMIEE100 pKa = 4.18SSAGHH105 pKa = 6.11HH106 pKa = 6.88AIAASSSAVVKK117 pKa = 10.3RR118 pKa = 11.84RR119 pKa = 11.84PGSTTANGYY128 pKa = 8.8LVPDD132 pKa = 3.98VKK134 pKa = 10.74RR135 pKa = 11.84IILQGRR141 pKa = 11.84VAARR145 pKa = 11.84KK146 pKa = 9.61GLVNLRR152 pKa = 11.84RR153 pKa = 11.84YY154 pKa = 8.83GWQTKK159 pKa = 7.77TKK161 pKa = 10.33
MM1 pKa = 6.87VAKK4 pKa = 10.15ICSDD8 pKa = 3.37PGYY11 pKa = 6.67TTLAFTCAPVIIACLRR27 pKa = 11.84LFRR30 pKa = 11.84PALRR34 pKa = 11.84GFICAICIAILAYY47 pKa = 10.22AATAFSTHH55 pKa = 5.35SFATIVTLGFSLLYY69 pKa = 10.24LAYY72 pKa = 9.7KK73 pKa = 9.85LLQWAIIRR81 pKa = 11.84CRR83 pKa = 11.84MCRR86 pKa = 11.84LGRR89 pKa = 11.84GYY91 pKa = 8.39ITAPSSMIEE100 pKa = 4.18SSAGHH105 pKa = 6.11HH106 pKa = 6.88AIAASSSAVVKK117 pKa = 10.3RR118 pKa = 11.84RR119 pKa = 11.84PGSTTANGYY128 pKa = 8.8LVPDD132 pKa = 3.98VKK134 pKa = 10.74RR135 pKa = 11.84IILQGRR141 pKa = 11.84VAARR145 pKa = 11.84KK146 pKa = 9.61GLVNLRR152 pKa = 11.84RR153 pKa = 11.84YY154 pKa = 8.83GWQTKK159 pKa = 7.77TKK161 pKa = 10.33
Molecular weight: 17.5 kDa
Isoelectric point according different methods:
Peptides (in silico digests for buttom-up proteomics)
Below you can find in silico digests of the whole proteome with Trypsin, Chymotrypsin, Trypsin+LysC, LysN, ArgC proteases suitable for different mass spec machines.| Try ESI |
 |
|---|
| ChTry ESI |
 |
|---|
| ArgC ESI |
 |
|---|
| LysN ESI |
 |
|---|
| TryLysC ESI |
 |
|---|
| Try MALDI |
 |
|---|
| ChTry MALDI |
 |
|---|
| ArgC MALDI |
 |
|---|
| LysN MALDI |
 |
|---|
| TryLysC MALDI |
 |
|---|
| Try LTQ |
 |
|---|
| ChTry LTQ |
 |
|---|
| ArgC LTQ |
 |
|---|
| LysN LTQ |
 |
|---|
| TryLysC LTQ |
 |
|---|
| Try MSlow |
 |
|---|
| ChTry MSlow |
 |
|---|
| ArgC MSlow |
 |
|---|
| LysN MSlow |
 |
|---|
| TryLysC MSlow |
 |
|---|
| Try MShigh |
 |
|---|
| ChTry MShigh |
 |
|---|
| ArgC MShigh |
 |
|---|
| LysN MShigh |
 |
|---|
| TryLysC MShigh |
 |
|---|
General Statistics
Number of major isoforms |
Number of additional isoforms |
Number of all proteins |
Number of amino acids |
Min. Seq. Length |
Max. Seq. Length |
Avg. Seq. Length |
Avg. Mol. Weight |
|---|---|---|---|---|---|---|---|
0 |
8564 |
52 |
3552 |
570.9 |
62.52 |
Amino acid frequency
Ala |
Cys |
Asp |
Glu |
Phe |
Gly |
His |
Ile |
Lys |
Leu |
|---|---|---|---|---|---|---|---|---|---|
8.921 ± 0.291 | 3.445 ± 0.118 |
4.39 ± 0.453 | 3.62 ± 0.282 |
4.005 ± 0.472 | 6.702 ± 0.455 |
2.604 ± 0.33 | 4.752 ± 0.289 |
3.596 ± 0.323 | 10.859 ± 0.445 |
Met |
Asn |
Gln |
Pro |
Arg |
Ser |
Thr |
Val |
Trp |
Tyr |
|---|---|---|---|---|---|---|---|---|---|
1.448 ± 0.303 | 3.024 ± 0.306 |
6.656 ± 0.63 | 3.363 ± 0.174 |
5.418 ± 0.259 | 8.209 ± 0.518 |
5.92 ± 0.368 | 7.917 ± 0.38 |
1.378 ± 0.202 | 3.772 ± 0.163 |
Most of the basic statistics you can see at this page can be downloaded from this CSV file
Proteome-pI is available under Creative Commons Attribution-NoDerivs license, for more details see here
| Reference: Kozlowski LP. Proteome-pI 2.0: Proteome Isoelectric Point Database Update. Nucleic Acids Res. 2021, doi: 10.1093/nar/gkab944 | Contact: Lukasz P. Kozlowski |
