Glis glis polyomavirus 1
Taxonomy: Viruses; Monodnaviria; Shotokuvirae; Cossaviricota; Papovaviricetes; Sepolyvirales; Polyomaviridae; Betapolyomavirus
Average proteome isoelectric point is 6.1
Get precalculated fractions of proteins

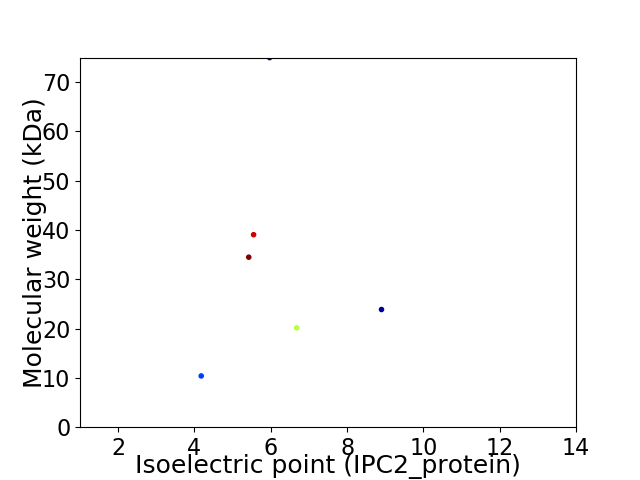
Virtual 2D-PAGE plot for 6 proteins (isoelectric point calculated using IPC2_protein)
Get csv file with sequences according to given criteria:
* You can choose from 21 different methods for calculating isoelectric point
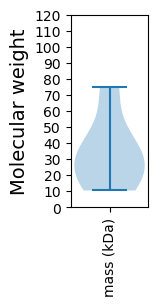
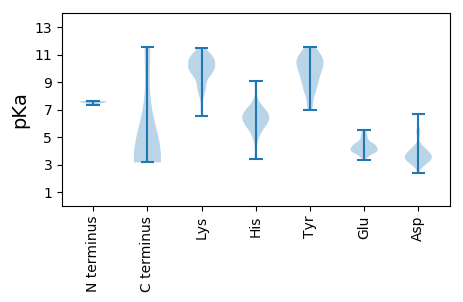
Summary statistics related to proteome-wise predictions


Protein with the lowest isoelectric point:
>tr|A0A2S1CJL7|A0A2S1CJL7_9POLY Large T antigen OS=Glis glis polyomavirus 1 OX=2170404 GN=650T PE=4 SV=1
MM1 pKa = 7.62LRR3 pKa = 11.84ILFQKK8 pKa = 9.91RR9 pKa = 11.84RR10 pKa = 11.84RR11 pKa = 11.84GEE13 pKa = 3.86EE14 pKa = 3.5EE15 pKa = 4.2GPRR18 pKa = 11.84EE19 pKa = 4.02GGAAVAAAAAGNGGAPSDD37 pKa = 4.19TEE39 pKa = 3.93PTTPARR45 pKa = 11.84NIASIRR51 pKa = 11.84LQEE54 pKa = 4.18VAPGPEE60 pKa = 4.38DD61 pKa = 3.51KK62 pKa = 10.63PGPEE66 pKa = 4.21DD67 pKa = 3.62TSDD70 pKa = 3.6TEE72 pKa = 4.33DD73 pKa = 3.34TLGTEE78 pKa = 4.45DD79 pKa = 4.18TSDD82 pKa = 3.81TEE84 pKa = 4.41DD85 pKa = 3.59TPSPEE90 pKa = 3.45VWGEE94 pKa = 3.59YY95 pKa = 9.71LQYY98 pKa = 11.57
MM1 pKa = 7.62LRR3 pKa = 11.84ILFQKK8 pKa = 9.91RR9 pKa = 11.84RR10 pKa = 11.84RR11 pKa = 11.84GEE13 pKa = 3.86EE14 pKa = 3.5EE15 pKa = 4.2GPRR18 pKa = 11.84EE19 pKa = 4.02GGAAVAAAAAGNGGAPSDD37 pKa = 4.19TEE39 pKa = 3.93PTTPARR45 pKa = 11.84NIASIRR51 pKa = 11.84LQEE54 pKa = 4.18VAPGPEE60 pKa = 4.38DD61 pKa = 3.51KK62 pKa = 10.63PGPEE66 pKa = 4.21DD67 pKa = 3.62TSDD70 pKa = 3.6TEE72 pKa = 4.33DD73 pKa = 3.34TLGTEE78 pKa = 4.45DD79 pKa = 4.18TSDD82 pKa = 3.81TEE84 pKa = 4.41DD85 pKa = 3.59TPSPEE90 pKa = 3.45VWGEE94 pKa = 3.59YY95 pKa = 9.71LQYY98 pKa = 11.57
Molecular weight: 10.4 kDa
Isoelectric point according different methods:
Protein with the highest isoelectric point:
>tr|A0A2S1CJL3|A0A2S1CJL3_9POLY Minor capsid protein VP2 OS=Glis glis polyomavirus 1 OX=2170404 GN=VP2 PE=3 SV=1
MM1 pKa = 7.61ALAPYY6 pKa = 10.24NPDD9 pKa = 2.62IDD11 pKa = 4.35YY12 pKa = 10.81DD13 pKa = 3.67ILFPGVSWFARR24 pKa = 11.84NIRR27 pKa = 11.84YY28 pKa = 8.54FDD30 pKa = 3.31PTFWTTRR37 pKa = 11.84LWQRR41 pKa = 11.84FVEE44 pKa = 4.53GLQRR48 pKa = 11.84EE49 pKa = 4.49AVRR52 pKa = 11.84QIAHH56 pKa = 5.66EE57 pKa = 4.22TNALGARR64 pKa = 11.84ARR66 pKa = 11.84EE67 pKa = 4.06QAALTLRR74 pKa = 11.84EE75 pKa = 3.68AVARR79 pKa = 11.84VVEE82 pKa = 4.11NTQWVFTNLGQGASNLYY99 pKa = 10.6ASVEE103 pKa = 4.06RR104 pKa = 11.84YY105 pKa = 9.14YY106 pKa = 11.56AEE108 pKa = 4.86LPGLNPAQRR117 pKa = 11.84RR118 pKa = 11.84ALMEE122 pKa = 4.15RR123 pKa = 11.84LPRR126 pKa = 11.84EE127 pKa = 4.58DD128 pKa = 3.53IVVPQQDD135 pKa = 4.29SLPQSGDD142 pKa = 3.16FVVRR146 pKa = 11.84YY147 pKa = 7.0EE148 pKa = 4.34APGGANQRR156 pKa = 11.84SCPNWLLPLILGIYY170 pKa = 7.28DD171 pKa = 3.98TTWGEE176 pKa = 4.21PVSKK180 pKa = 10.3HH181 pKa = 3.42ATKK184 pKa = 10.41RR185 pKa = 11.84KK186 pKa = 9.93SSAEE190 pKa = 3.72DD191 pKa = 3.09TGPKK195 pKa = 8.9TNCKK199 pKa = 9.65RR200 pKa = 11.84KK201 pKa = 9.8RR202 pKa = 11.84GSPGSKK208 pKa = 9.83NRR210 pKa = 11.84AA211 pKa = 3.29
MM1 pKa = 7.61ALAPYY6 pKa = 10.24NPDD9 pKa = 2.62IDD11 pKa = 4.35YY12 pKa = 10.81DD13 pKa = 3.67ILFPGVSWFARR24 pKa = 11.84NIRR27 pKa = 11.84YY28 pKa = 8.54FDD30 pKa = 3.31PTFWTTRR37 pKa = 11.84LWQRR41 pKa = 11.84FVEE44 pKa = 4.53GLQRR48 pKa = 11.84EE49 pKa = 4.49AVRR52 pKa = 11.84QIAHH56 pKa = 5.66EE57 pKa = 4.22TNALGARR64 pKa = 11.84ARR66 pKa = 11.84EE67 pKa = 4.06QAALTLRR74 pKa = 11.84EE75 pKa = 3.68AVARR79 pKa = 11.84VVEE82 pKa = 4.11NTQWVFTNLGQGASNLYY99 pKa = 10.6ASVEE103 pKa = 4.06RR104 pKa = 11.84YY105 pKa = 9.14YY106 pKa = 11.56AEE108 pKa = 4.86LPGLNPAQRR117 pKa = 11.84RR118 pKa = 11.84ALMEE122 pKa = 4.15RR123 pKa = 11.84LPRR126 pKa = 11.84EE127 pKa = 4.58DD128 pKa = 3.53IVVPQQDD135 pKa = 4.29SLPQSGDD142 pKa = 3.16FVVRR146 pKa = 11.84YY147 pKa = 7.0EE148 pKa = 4.34APGGANQRR156 pKa = 11.84SCPNWLLPLILGIYY170 pKa = 7.28DD171 pKa = 3.98TTWGEE176 pKa = 4.21PVSKK180 pKa = 10.3HH181 pKa = 3.42ATKK184 pKa = 10.41RR185 pKa = 11.84KK186 pKa = 9.93SSAEE190 pKa = 3.72DD191 pKa = 3.09TGPKK195 pKa = 8.9TNCKK199 pKa = 9.65RR200 pKa = 11.84KK201 pKa = 9.8RR202 pKa = 11.84GSPGSKK208 pKa = 9.83NRR210 pKa = 11.84AA211 pKa = 3.29
Molecular weight: 23.88 kDa
Isoelectric point according different methods:
Peptides (in silico digests for buttom-up proteomics)
Below you can find in silico digests of the whole proteome with Trypsin, Chymotrypsin, Trypsin+LysC, LysN, ArgC proteases suitable for different mass spec machines.| Try ESI |
 |
|---|
| ChTry ESI |
 |
|---|
| ArgC ESI |
 |
|---|
| LysN ESI |
 |
|---|
| TryLysC ESI |
 |
|---|
| Try MALDI |
 |
|---|
| ChTry MALDI |
 |
|---|
| ArgC MALDI |
 |
|---|
| LysN MALDI |
 |
|---|
| TryLysC MALDI |
 |
|---|
| Try LTQ |
 |
|---|
| ChTry LTQ |
 |
|---|
| ArgC LTQ |
 |
|---|
| LysN LTQ |
 |
|---|
| TryLysC LTQ |
 |
|---|
| Try MSlow |
 |
|---|
| ChTry MSlow |
 |
|---|
| ArgC MSlow |
 |
|---|
| LysN MSlow |
 |
|---|
| TryLysC MSlow |
 |
|---|
| Try MShigh |
 |
|---|
| ChTry MShigh |
 |
|---|
| ArgC MShigh |
 |
|---|
| LysN MShigh |
 |
|---|
| TryLysC MShigh |
 |
|---|
General Statistics
Number of major isoforms |
Number of additional isoforms |
Number of all proteins |
Number of amino acids |
Min. Seq. Length |
Max. Seq. Length |
Avg. Seq. Length |
Avg. Mol. Weight |
|---|---|---|---|---|---|---|---|
0 |
1801 |
98 |
650 |
300.2 |
33.83 |
Amino acid frequency
Ala |
Cys |
Asp |
Glu |
Phe |
Gly |
His |
Ile |
Lys |
Leu |
|---|---|---|---|---|---|---|---|---|---|
7.385 ± 1.295 | 2.221 ± 0.554 |
5.33 ± 0.542 | 6.885 ± 0.584 |
3.776 ± 0.527 | 6.774 ± 0.908 |
1.943 ± 0.593 | 4.553 ± 0.369 |
4.942 ± 0.774 | 9.606 ± 0.644 |
Met |
Asn |
Gln |
Pro |
Arg |
Ser |
Thr |
Val |
Trp |
Tyr |
|---|---|---|---|---|---|---|---|---|---|
2.554 ± 0.53 | 4.997 ± 0.343 |
5.941 ± 0.794 | 4.442 ± 0.608 |
6.163 ± 0.54 | 5.497 ± 0.176 |
6.496 ± 0.355 | 5.386 ± 0.654 |
2.054 ± 0.257 | 3.054 ± 0.222 |
Most of the basic statistics you can see at this page can be downloaded from this CSV file
Proteome-pI is available under Creative Commons Attribution-NoDerivs license, for more details see here
| Reference: Kozlowski LP. Proteome-pI 2.0: Proteome Isoelectric Point Database Update. Nucleic Acids Res. 2021, doi: 10.1093/nar/gkab944 | Contact: Lukasz P. Kozlowski |
