Nocardioides zeae
Taxonomy: cellular organisms; Bacteria; Terrabacteria group; Actinobacteria; Actinomycetia; Propionibacteriales; Nocardioidaceae; Nocardioides
Average proteome isoelectric point is 5.93
Get precalculated fractions of proteins

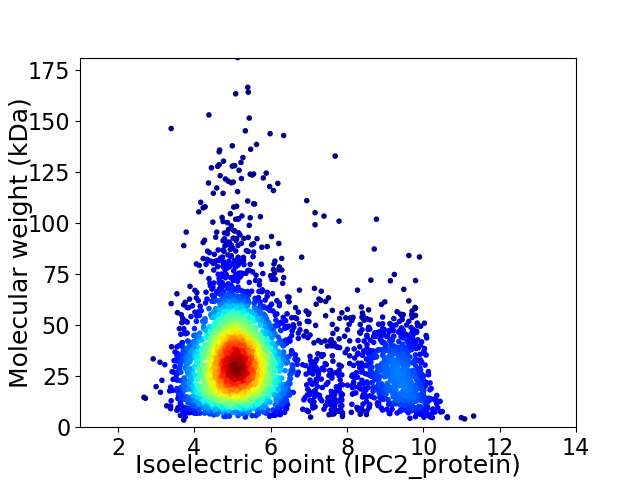
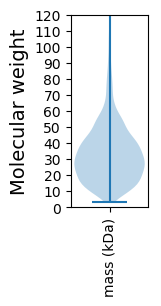
Virtual 2D-PAGE plot for 4048 proteins (isoelectric point calculated using IPC2_protein)
Get csv file with sequences according to given criteria:
* You can choose from 21 different methods for calculating isoelectric point
Summary statistics related to proteome-wise predictions


Protein with the lowest isoelectric point:
>tr|A0A6P0HJL2|A0A6P0HJL2_9ACTN S8 family serine peptidase OS=Nocardioides zeae OX=1457234 GN=G3T38_10995 PE=3 SV=1
MM1 pKa = 7.77SDD3 pKa = 3.67QPPTPYY9 pKa = 9.93PGEE12 pKa = 4.44PGPYY16 pKa = 9.34AAPHH20 pKa = 6.23PPSYY24 pKa = 10.25PVGSLAPQHH33 pKa = 6.43LAPPPPSLPTDD44 pKa = 4.1GPSPHH49 pKa = 6.95APAGDD54 pKa = 3.76GSRR57 pKa = 11.84LASAALALACLPLGVTNALGVVLGAVGMAAGPRR90 pKa = 11.84VRR92 pKa = 11.84PRR94 pKa = 11.84WGMSVAAVVVGTLWMAAGTGIGVAVWAGDD123 pKa = 3.62RR124 pKa = 11.84DD125 pKa = 4.05GSADD129 pKa = 3.91PDD131 pKa = 3.63TAARR135 pKa = 11.84VAEE138 pKa = 4.84LGDD141 pKa = 4.43EE142 pKa = 4.19IDD144 pKa = 4.93DD145 pKa = 4.44LRR147 pKa = 11.84GDD149 pKa = 4.52LFAAMGPGGAYY160 pKa = 10.15SDD162 pKa = 4.05TEE164 pKa = 4.33VLSEE168 pKa = 5.56LDD170 pKa = 4.94DD171 pKa = 4.25EE172 pKa = 4.89DD173 pKa = 3.46EE174 pKa = 4.28RR175 pKa = 11.84AAVEE179 pKa = 4.46LLAEE183 pKa = 4.55DD184 pKa = 4.42VPVADD189 pKa = 5.14LATGACVLDD198 pKa = 3.84PALNQVLWTGEE209 pKa = 3.98HH210 pKa = 6.71LPTVLATVDD219 pKa = 3.54CADD222 pKa = 3.27VHH224 pKa = 6.01DD225 pKa = 4.9AEE227 pKa = 4.78MVGSITVPDD236 pKa = 5.39RR237 pKa = 11.84IAEE240 pKa = 4.54DD241 pKa = 3.77GWDD244 pKa = 3.74SDD246 pKa = 4.38PFLDD250 pKa = 5.16FAWDD254 pKa = 3.42ACDD257 pKa = 4.6DD258 pKa = 3.72AFYY261 pKa = 10.71DD262 pKa = 3.98YY263 pKa = 11.49AGDD266 pKa = 3.65AGYY269 pKa = 10.12WDD271 pKa = 4.38AEE273 pKa = 3.96EE274 pKa = 4.58TYY276 pKa = 11.12AAFVPPSEE284 pKa = 4.48EE285 pKa = 3.5AWDD288 pKa = 3.89AGEE291 pKa = 4.3RR292 pKa = 11.84AIACFASSEE301 pKa = 4.12GLTSGSLRR309 pKa = 11.84AVEE312 pKa = 4.39AGG314 pKa = 3.25
MM1 pKa = 7.77SDD3 pKa = 3.67QPPTPYY9 pKa = 9.93PGEE12 pKa = 4.44PGPYY16 pKa = 9.34AAPHH20 pKa = 6.23PPSYY24 pKa = 10.25PVGSLAPQHH33 pKa = 6.43LAPPPPSLPTDD44 pKa = 4.1GPSPHH49 pKa = 6.95APAGDD54 pKa = 3.76GSRR57 pKa = 11.84LASAALALACLPLGVTNALGVVLGAVGMAAGPRR90 pKa = 11.84VRR92 pKa = 11.84PRR94 pKa = 11.84WGMSVAAVVVGTLWMAAGTGIGVAVWAGDD123 pKa = 3.62RR124 pKa = 11.84DD125 pKa = 4.05GSADD129 pKa = 3.91PDD131 pKa = 3.63TAARR135 pKa = 11.84VAEE138 pKa = 4.84LGDD141 pKa = 4.43EE142 pKa = 4.19IDD144 pKa = 4.93DD145 pKa = 4.44LRR147 pKa = 11.84GDD149 pKa = 4.52LFAAMGPGGAYY160 pKa = 10.15SDD162 pKa = 4.05TEE164 pKa = 4.33VLSEE168 pKa = 5.56LDD170 pKa = 4.94DD171 pKa = 4.25EE172 pKa = 4.89DD173 pKa = 3.46EE174 pKa = 4.28RR175 pKa = 11.84AAVEE179 pKa = 4.46LLAEE183 pKa = 4.55DD184 pKa = 4.42VPVADD189 pKa = 5.14LATGACVLDD198 pKa = 3.84PALNQVLWTGEE209 pKa = 3.98HH210 pKa = 6.71LPTVLATVDD219 pKa = 3.54CADD222 pKa = 3.27VHH224 pKa = 6.01DD225 pKa = 4.9AEE227 pKa = 4.78MVGSITVPDD236 pKa = 5.39RR237 pKa = 11.84IAEE240 pKa = 4.54DD241 pKa = 3.77GWDD244 pKa = 3.74SDD246 pKa = 4.38PFLDD250 pKa = 5.16FAWDD254 pKa = 3.42ACDD257 pKa = 4.6DD258 pKa = 3.72AFYY261 pKa = 10.71DD262 pKa = 3.98YY263 pKa = 11.49AGDD266 pKa = 3.65AGYY269 pKa = 10.12WDD271 pKa = 4.38AEE273 pKa = 3.96EE274 pKa = 4.58TYY276 pKa = 11.12AAFVPPSEE284 pKa = 4.48EE285 pKa = 3.5AWDD288 pKa = 3.89AGEE291 pKa = 4.3RR292 pKa = 11.84AIACFASSEE301 pKa = 4.12GLTSGSLRR309 pKa = 11.84AVEE312 pKa = 4.39AGG314 pKa = 3.25
Molecular weight: 32.18 kDa
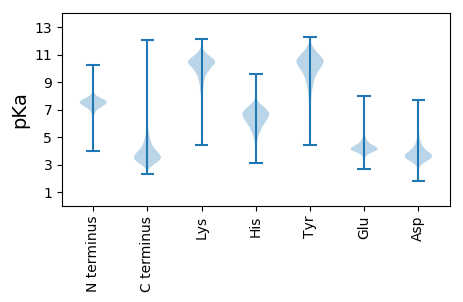
Isoelectric point according different methods:
Protein with the highest isoelectric point:
>tr|A0A6P0HHK6|A0A6P0HHK6_9ACTN WYL domain-containing protein OS=Nocardioides zeae OX=1457234 GN=G3T38_02365 PE=4 SV=1
MM1 pKa = 7.69SKK3 pKa = 9.0RR4 pKa = 11.84TFQPNNRR11 pKa = 11.84RR12 pKa = 11.84RR13 pKa = 11.84HH14 pKa = 4.97KK15 pKa = 10.04VHH17 pKa = 6.59GFRR20 pKa = 11.84LRR22 pKa = 11.84MRR24 pKa = 11.84TRR26 pKa = 11.84AGRR29 pKa = 11.84AIITARR35 pKa = 11.84RR36 pKa = 11.84RR37 pKa = 11.84KK38 pKa = 9.09GRR40 pKa = 11.84KK41 pKa = 9.0SLTVV45 pKa = 3.12
MM1 pKa = 7.69SKK3 pKa = 9.0RR4 pKa = 11.84TFQPNNRR11 pKa = 11.84RR12 pKa = 11.84RR13 pKa = 11.84HH14 pKa = 4.97KK15 pKa = 10.04VHH17 pKa = 6.59GFRR20 pKa = 11.84LRR22 pKa = 11.84MRR24 pKa = 11.84TRR26 pKa = 11.84AGRR29 pKa = 11.84AIITARR35 pKa = 11.84RR36 pKa = 11.84RR37 pKa = 11.84KK38 pKa = 9.09GRR40 pKa = 11.84KK41 pKa = 9.0SLTVV45 pKa = 3.12
Molecular weight: 5.46 kDa
Isoelectric point according different methods:
Peptides (in silico digests for buttom-up proteomics)
Below you can find in silico digests of the whole proteome with Trypsin, Chymotrypsin, Trypsin+LysC, LysN, ArgC proteases suitable for different mass spec machines.| Try ESI |
 |
|---|
| ChTry ESI |
 |
|---|
| ArgC ESI |
 |
|---|
| LysN ESI |
 |
|---|
| TryLysC ESI |
 |
|---|
| Try MALDI |
 |
|---|
| ChTry MALDI |
 |
|---|
| ArgC MALDI |
 |
|---|
| LysN MALDI |
 |
|---|
| TryLysC MALDI |
 |
|---|
| Try LTQ |
 |
|---|
| ChTry LTQ |
 |
|---|
| ArgC LTQ |
 |
|---|
| LysN LTQ |
 |
|---|
| TryLysC LTQ |
 |
|---|
| Try MSlow |
 |
|---|
| ChTry MSlow |
 |
|---|
| ArgC MSlow |
 |
|---|
| LysN MSlow |
 |
|---|
| TryLysC MSlow |
 |
|---|
| Try MShigh |
 |
|---|
| ChTry MShigh |
 |
|---|
| ArgC MShigh |
 |
|---|
| LysN MShigh |
 |
|---|
| TryLysC MShigh |
 |
|---|
General Statistics
Number of major isoforms |
Number of additional isoforms |
Number of all proteins |
Number of amino acids |
Min. Seq. Length |
Max. Seq. Length |
Avg. Seq. Length |
Avg. Mol. Weight |
|---|---|---|---|---|---|---|---|
0 |
1324490 |
32 |
1659 |
327.2 |
34.73 |
Amino acid frequency
Ala |
Cys |
Asp |
Glu |
Phe |
Gly |
His |
Ile |
Lys |
Leu |
|---|---|---|---|---|---|---|---|---|---|
14.174 ± 0.057 | 0.667 ± 0.011 |
6.558 ± 0.03 | 5.755 ± 0.033 |
2.561 ± 0.02 | 9.573 ± 0.033 |
2.117 ± 0.02 | 2.926 ± 0.023 |
1.493 ± 0.026 | 10.413 ± 0.048 |
Met |
Asn |
Gln |
Pro |
Arg |
Ser |
Thr |
Val |
Trp |
Tyr |
|---|---|---|---|---|---|---|---|---|---|
1.594 ± 0.014 | 1.499 ± 0.018 |
5.844 ± 0.031 | 2.497 ± 0.019 |
7.883 ± 0.041 | 4.842 ± 0.024 |
6.154 ± 0.033 | 10.157 ± 0.04 |
1.473 ± 0.015 | 1.819 ± 0.017 |
Most of the basic statistics you can see at this page can be downloaded from this CSV file
Proteome-pI is available under Creative Commons Attribution-NoDerivs license, for more details see here
| Reference: Kozlowski LP. Proteome-pI 2.0: Proteome Isoelectric Point Database Update. Nucleic Acids Res. 2021, doi: 10.1093/nar/gkab944 | Contact: Lukasz P. Kozlowski |
