Joostella marina DSM 19592
Taxonomy: cellular organisms; Bacteria; FCB group; Bacteroidetes/Chlorobi group; Bacteroidetes; Flavobacteriia; Flavobacteriales; Flavobacteriaceae; Joostella; Joostella marina
Average proteome isoelectric point is 6.52
Get precalculated fractions of proteins

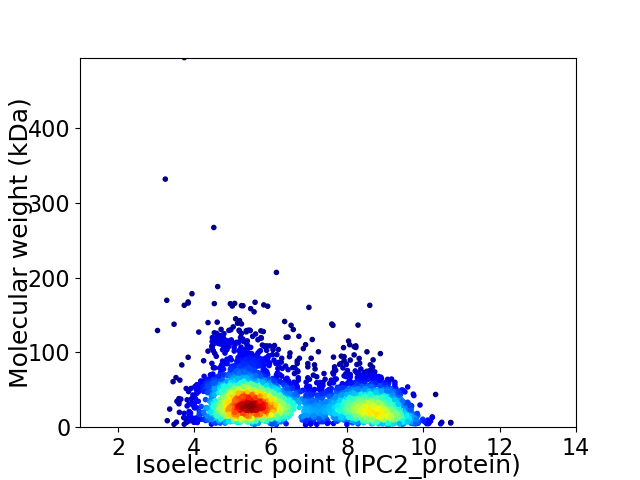
Virtual 2D-PAGE plot for 3783 proteins (isoelectric point calculated using IPC2_protein)
Get csv file with sequences according to given criteria:
* You can choose from 21 different methods for calculating isoelectric point
Summary statistics related to proteome-wise predictions


Protein with the lowest isoelectric point:
>tr|I3CB81|I3CB81_9FLAO Uncharacterized protein OS=Joostella marina DSM 19592 OX=926559 GN=JoomaDRAFT_3950 PE=4 SV=1
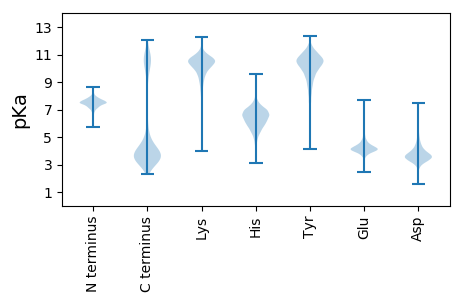
MM1 pKa = 7.5KK2 pKa = 10.09VNKK5 pKa = 10.02IIGLWGSVLILLFSACQPIEE25 pKa = 4.0DD26 pKa = 4.41RR27 pKa = 11.84EE28 pKa = 4.14EE29 pKa = 4.43LEE31 pKa = 4.18NTTDD35 pKa = 3.59ADD37 pKa = 4.07GVKK40 pKa = 10.21LVATQATAGGNLVEE54 pKa = 5.84LSMEE58 pKa = 4.23TLGVTGYY65 pKa = 10.46WDD67 pKa = 3.78FNLGKK72 pKa = 10.45GLTDD76 pKa = 4.63RR77 pKa = 11.84IEE79 pKa = 3.91IVYY82 pKa = 7.46PIPGATTFTYY92 pKa = 10.66VGTLGGEE99 pKa = 4.51FFSKK103 pKa = 9.95TIDD106 pKa = 3.65VQIDD110 pKa = 3.84TLDD113 pKa = 3.51HH114 pKa = 6.95ALNQDD119 pKa = 2.87WYY121 pKa = 10.14DD122 pKa = 3.72LVSEE126 pKa = 4.3EE127 pKa = 4.28TSVGKK132 pKa = 8.33TWVFAGGPGADD143 pKa = 3.67GGKK146 pKa = 7.22WWYY149 pKa = 9.04MSPPDD154 pKa = 5.72DD155 pKa = 3.96PASWEE160 pKa = 4.28TAWWNAAGDD169 pKa = 4.11CCPPGDD175 pKa = 4.49AAGKK179 pKa = 8.18MHH181 pKa = 7.38FDD183 pKa = 3.81LDD185 pKa = 3.77GAGNYY190 pKa = 7.98TYY192 pKa = 11.28YY193 pKa = 11.04SDD195 pKa = 3.57TDD197 pKa = 3.72VEE199 pKa = 4.66GEE201 pKa = 4.15TGSFVLDD208 pKa = 3.49VANQTLQVNGSNILGAEE225 pKa = 4.02QGNPAGLYY233 pKa = 9.2TIISLTEE240 pKa = 4.21DD241 pKa = 3.4EE242 pKa = 5.55LILYY246 pKa = 7.55LANNAGGTGWTWVFKK261 pKa = 11.03PEE263 pKa = 3.77
MM1 pKa = 7.5KK2 pKa = 10.09VNKK5 pKa = 10.02IIGLWGSVLILLFSACQPIEE25 pKa = 4.0DD26 pKa = 4.41RR27 pKa = 11.84EE28 pKa = 4.14EE29 pKa = 4.43LEE31 pKa = 4.18NTTDD35 pKa = 3.59ADD37 pKa = 4.07GVKK40 pKa = 10.21LVATQATAGGNLVEE54 pKa = 5.84LSMEE58 pKa = 4.23TLGVTGYY65 pKa = 10.46WDD67 pKa = 3.78FNLGKK72 pKa = 10.45GLTDD76 pKa = 4.63RR77 pKa = 11.84IEE79 pKa = 3.91IVYY82 pKa = 7.46PIPGATTFTYY92 pKa = 10.66VGTLGGEE99 pKa = 4.51FFSKK103 pKa = 9.95TIDD106 pKa = 3.65VQIDD110 pKa = 3.84TLDD113 pKa = 3.51HH114 pKa = 6.95ALNQDD119 pKa = 2.87WYY121 pKa = 10.14DD122 pKa = 3.72LVSEE126 pKa = 4.3EE127 pKa = 4.28TSVGKK132 pKa = 8.33TWVFAGGPGADD143 pKa = 3.67GGKK146 pKa = 7.22WWYY149 pKa = 9.04MSPPDD154 pKa = 5.72DD155 pKa = 3.96PASWEE160 pKa = 4.28TAWWNAAGDD169 pKa = 4.11CCPPGDD175 pKa = 4.49AAGKK179 pKa = 8.18MHH181 pKa = 7.38FDD183 pKa = 3.81LDD185 pKa = 3.77GAGNYY190 pKa = 7.98TYY192 pKa = 11.28YY193 pKa = 11.04SDD195 pKa = 3.57TDD197 pKa = 3.72VEE199 pKa = 4.66GEE201 pKa = 4.15TGSFVLDD208 pKa = 3.49VANQTLQVNGSNILGAEE225 pKa = 4.02QGNPAGLYY233 pKa = 9.2TIISLTEE240 pKa = 4.21DD241 pKa = 3.4EE242 pKa = 5.55LILYY246 pKa = 7.55LANNAGGTGWTWVFKK261 pKa = 11.03PEE263 pKa = 3.77
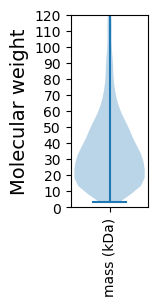
Molecular weight: 28.38 kDa
Isoelectric point according different methods:
Protein with the highest isoelectric point:
>tr|I3C581|I3C581_9FLAO Bacterial cell division membrane protein OS=Joostella marina DSM 19592 OX=926559 GN=JoomaDRAFT_1767 PE=4 SV=1
MM1 pKa = 7.26LRR3 pKa = 11.84WTIIFLIVAIVAAVFGFGGIAGAAAGIAKK32 pKa = 9.99ILFFVFLVLFVISLISRR49 pKa = 11.84MTRR52 pKa = 11.84RR53 pKa = 3.46
MM1 pKa = 7.26LRR3 pKa = 11.84WTIIFLIVAIVAAVFGFGGIAGAAAGIAKK32 pKa = 9.99ILFFVFLVLFVISLISRR49 pKa = 11.84MTRR52 pKa = 11.84RR53 pKa = 3.46
Molecular weight: 5.77 kDa
Isoelectric point according different methods:
Peptides (in silico digests for buttom-up proteomics)
Below you can find in silico digests of the whole proteome with Trypsin, Chymotrypsin, Trypsin+LysC, LysN, ArgC proteases suitable for different mass spec machines.| Try ESI |
 |
|---|
| ChTry ESI |
 |
|---|
| ArgC ESI |
 |
|---|
| LysN ESI |
 |
|---|
| TryLysC ESI |
 |
|---|
| Try MALDI |
 |
|---|
| ChTry MALDI |
 |
|---|
| ArgC MALDI |
 |
|---|
| LysN MALDI |
 |
|---|
| TryLysC MALDI |
 |
|---|
| Try LTQ |
 |
|---|
| ChTry LTQ |
 |
|---|
| ArgC LTQ |
 |
|---|
| LysN LTQ |
 |
|---|
| TryLysC LTQ |
 |
|---|
| Try MSlow |
 |
|---|
| ChTry MSlow |
 |
|---|
| ArgC MSlow |
 |
|---|
| LysN MSlow |
 |
|---|
| TryLysC MSlow |
 |
|---|
| Try MShigh |
 |
|---|
| ChTry MShigh |
 |
|---|
| ArgC MShigh |
 |
|---|
| LysN MShigh |
 |
|---|
| TryLysC MShigh |
 |
|---|
General Statistics
Number of major isoforms |
Number of additional isoforms |
Number of all proteins |
Number of amino acids |
Min. Seq. Length |
Max. Seq. Length |
Avg. Seq. Length |
Avg. Mol. Weight |
|---|---|---|---|---|---|---|---|
0 |
1268527 |
29 |
4610 |
335.3 |
37.89 |
Amino acid frequency
Ala |
Cys |
Asp |
Glu |
Phe |
Gly |
His |
Ile |
Lys |
Leu |
|---|---|---|---|---|---|---|---|---|---|
6.37 ± 0.039 | 0.699 ± 0.014 |
5.478 ± 0.034 | 6.98 ± 0.041 |
5.057 ± 0.029 | 6.353 ± 0.039 |
1.713 ± 0.017 | 8.034 ± 0.041 |
8.026 ± 0.053 | 9.139 ± 0.039 |
Met |
Asn |
Gln |
Pro |
Arg |
Ser |
Thr |
Val |
Trp |
Tyr |
|---|---|---|---|---|---|---|---|---|---|
2.182 ± 0.018 | 6.283 ± 0.038 |
3.347 ± 0.022 | 3.298 ± 0.024 |
3.359 ± 0.027 | 6.45 ± 0.031 |
5.758 ± 0.041 | 6.148 ± 0.028 |
1.084 ± 0.015 | 4.24 ± 0.029 |
Most of the basic statistics you can see at this page can be downloaded from this CSV file
Proteome-pI is available under Creative Commons Attribution-NoDerivs license, for more details see here
| Reference: Kozlowski LP. Proteome-pI 2.0: Proteome Isoelectric Point Database Update. Nucleic Acids Res. 2021, doi: 10.1093/nar/gkab944 | Contact: Lukasz P. Kozlowski |
