Spirochaeta lutea
Taxonomy: cellular organisms; Bacteria; Spirochaetes; Spirochaetia; Spirochaetales; Spirochaetaceae; Spirochaeta
Average proteome isoelectric point is 6.09
Get precalculated fractions of proteins

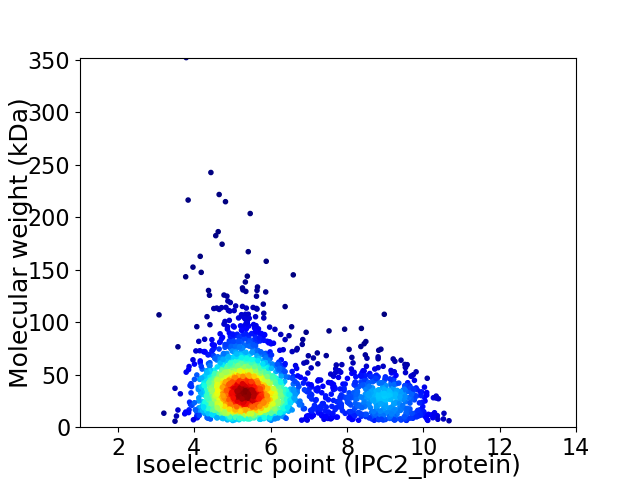
Virtual 2D-PAGE plot for 2285 proteins (isoelectric point calculated using IPC2_protein)
Get csv file with sequences according to given criteria:
* You can choose from 21 different methods for calculating isoelectric point
Summary statistics related to proteome-wise predictions


Protein with the lowest isoelectric point:
>tr|A0A098QZ15|A0A098QZ15_9SPIO Uncharacterized protein OS=Spirochaeta lutea OX=1480694 GN=DC28_10850 PE=4 SV=1
MM1 pKa = 7.67KK2 pKa = 9.06KK3 pKa = 7.89TLGVIAVLLLLVGLLAGCDD22 pKa = 3.33GMVIIGNDD30 pKa = 3.53LAGHH34 pKa = 5.0TWEE37 pKa = 4.81GRR39 pKa = 11.84VDD41 pKa = 3.75VLGLAGADD49 pKa = 3.39YY50 pKa = 10.93EE51 pKa = 5.14LRR53 pKa = 11.84FLTASTGEE61 pKa = 3.94YY62 pKa = 9.07WEE64 pKa = 4.15QVDD67 pKa = 3.8VLGGLGVAQAEE78 pKa = 4.74TTDD81 pKa = 3.72FTYY84 pKa = 10.83EE85 pKa = 3.97FDD87 pKa = 5.16PIEE90 pKa = 4.11MTGSIDD96 pKa = 5.07FSDD99 pKa = 3.49GDD101 pKa = 3.56YY102 pKa = 8.2WTFKK106 pKa = 10.72IEE108 pKa = 4.24TNNDD112 pKa = 3.51LTWTDD117 pKa = 2.34SGYY120 pKa = 11.25NYY122 pKa = 8.28TATYY126 pKa = 9.52KK127 pKa = 10.84
MM1 pKa = 7.67KK2 pKa = 9.06KK3 pKa = 7.89TLGVIAVLLLLVGLLAGCDD22 pKa = 3.33GMVIIGNDD30 pKa = 3.53LAGHH34 pKa = 5.0TWEE37 pKa = 4.81GRR39 pKa = 11.84VDD41 pKa = 3.75VLGLAGADD49 pKa = 3.39YY50 pKa = 10.93EE51 pKa = 5.14LRR53 pKa = 11.84FLTASTGEE61 pKa = 3.94YY62 pKa = 9.07WEE64 pKa = 4.15QVDD67 pKa = 3.8VLGGLGVAQAEE78 pKa = 4.74TTDD81 pKa = 3.72FTYY84 pKa = 10.83EE85 pKa = 3.97FDD87 pKa = 5.16PIEE90 pKa = 4.11MTGSIDD96 pKa = 5.07FSDD99 pKa = 3.49GDD101 pKa = 3.56YY102 pKa = 8.2WTFKK106 pKa = 10.72IEE108 pKa = 4.24TNNDD112 pKa = 3.51LTWTDD117 pKa = 2.34SGYY120 pKa = 11.25NYY122 pKa = 8.28TATYY126 pKa = 9.52KK127 pKa = 10.84
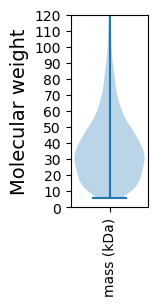
Molecular weight: 13.91 kDa
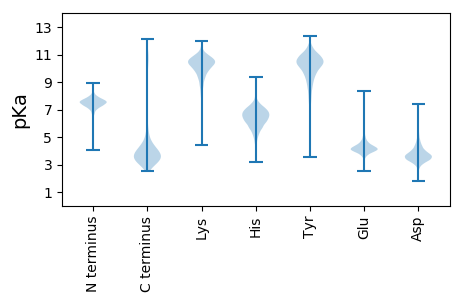
Isoelectric point according different methods:
Protein with the highest isoelectric point:
>tr|A0A098R1T2|A0A098R1T2_9SPIO Uncharacterized protein OS=Spirochaeta lutea OX=1480694 GN=DC28_06365 PE=4 SV=1
MM1 pKa = 7.42LLSAAGLGGFILIWEE16 pKa = 4.5LSGRR20 pKa = 11.84AGLLPGTLIPLPSQVPQALARR41 pKa = 11.84EE42 pKa = 4.13MALPGIGLPGGLWMAKK58 pKa = 8.7VLQSLGHH65 pKa = 5.37YY66 pKa = 10.08LRR68 pKa = 11.84GVLGGIGAGVILGLTAGSLPKK89 pKa = 10.3LAALLQGLVRR99 pKa = 11.84LLRR102 pKa = 11.84PIPPLAWIPFAIIWFGITPAASAFIIFVGVFWINFLSTLGTVQHH146 pKa = 6.55SNPDD150 pKa = 3.43FRR152 pKa = 11.84EE153 pKa = 4.02VAHH156 pKa = 5.98VFGFGRR162 pKa = 11.84FLPRR166 pKa = 11.84LLHH169 pKa = 4.28VTIPEE174 pKa = 4.31SLPGMLTGIRR184 pKa = 11.84TSLGMGWMAVVASEE198 pKa = 4.52LFGIPGIGEE207 pKa = 4.27RR208 pKa = 11.84MNQAAGLLATDD219 pKa = 3.66IVLVYY224 pKa = 9.43MLTIAGLYY232 pKa = 9.4TLFDD236 pKa = 3.84SAFSLIQRR244 pKa = 11.84RR245 pKa = 11.84LTRR248 pKa = 11.84WLPKK252 pKa = 9.88EE253 pKa = 3.85
MM1 pKa = 7.42LLSAAGLGGFILIWEE16 pKa = 4.5LSGRR20 pKa = 11.84AGLLPGTLIPLPSQVPQALARR41 pKa = 11.84EE42 pKa = 4.13MALPGIGLPGGLWMAKK58 pKa = 8.7VLQSLGHH65 pKa = 5.37YY66 pKa = 10.08LRR68 pKa = 11.84GVLGGIGAGVILGLTAGSLPKK89 pKa = 10.3LAALLQGLVRR99 pKa = 11.84LLRR102 pKa = 11.84PIPPLAWIPFAIIWFGITPAASAFIIFVGVFWINFLSTLGTVQHH146 pKa = 6.55SNPDD150 pKa = 3.43FRR152 pKa = 11.84EE153 pKa = 4.02VAHH156 pKa = 5.98VFGFGRR162 pKa = 11.84FLPRR166 pKa = 11.84LLHH169 pKa = 4.28VTIPEE174 pKa = 4.31SLPGMLTGIRR184 pKa = 11.84TSLGMGWMAVVASEE198 pKa = 4.52LFGIPGIGEE207 pKa = 4.27RR208 pKa = 11.84MNQAAGLLATDD219 pKa = 3.66IVLVYY224 pKa = 9.43MLTIAGLYY232 pKa = 9.4TLFDD236 pKa = 3.84SAFSLIQRR244 pKa = 11.84RR245 pKa = 11.84LTRR248 pKa = 11.84WLPKK252 pKa = 9.88EE253 pKa = 3.85
Molecular weight: 27.01 kDa
Isoelectric point according different methods:
Peptides (in silico digests for buttom-up proteomics)
Below you can find in silico digests of the whole proteome with Trypsin, Chymotrypsin, Trypsin+LysC, LysN, ArgC proteases suitable for different mass spec machines.| Try ESI |
 |
|---|
| ChTry ESI |
 |
|---|
| ArgC ESI |
 |
|---|
| LysN ESI |
 |
|---|
| TryLysC ESI |
 |
|---|
| Try MALDI |
 |
|---|
| ChTry MALDI |
 |
|---|
| ArgC MALDI |
 |
|---|
| LysN MALDI |
 |
|---|
| TryLysC MALDI |
 |
|---|
| Try LTQ |
 |
|---|
| ChTry LTQ |
 |
|---|
| ArgC LTQ |
 |
|---|
| LysN LTQ |
 |
|---|
| TryLysC LTQ |
 |
|---|
| Try MSlow |
 |
|---|
| ChTry MSlow |
 |
|---|
| ArgC MSlow |
 |
|---|
| LysN MSlow |
 |
|---|
| TryLysC MSlow |
 |
|---|
| Try MShigh |
 |
|---|
| ChTry MShigh |
 |
|---|
| ArgC MShigh |
 |
|---|
| LysN MShigh |
 |
|---|
| TryLysC MShigh |
 |
|---|
General Statistics
Number of major isoforms |
Number of additional isoforms |
Number of all proteins |
Number of amino acids |
Min. Seq. Length |
Max. Seq. Length |
Avg. Seq. Length |
Avg. Mol. Weight |
|---|---|---|---|---|---|---|---|
0 |
806388 |
51 |
3356 |
352.9 |
39.13 |
Amino acid frequency
Ala |
Cys |
Asp |
Glu |
Phe |
Gly |
His |
Ile |
Lys |
Leu |
|---|---|---|---|---|---|---|---|---|---|
7.843 ± 0.048 | 0.659 ± 0.015 |
5.399 ± 0.037 | 6.667 ± 0.046 |
4.188 ± 0.035 | 8.196 ± 0.053 |
1.942 ± 0.026 | 6.517 ± 0.044 |
3.744 ± 0.051 | 10.788 ± 0.061 |
Met |
Asn |
Gln |
Pro |
Arg |
Ser |
Thr |
Val |
Trp |
Tyr |
|---|---|---|---|---|---|---|---|---|---|
2.218 ± 0.023 | 3.322 ± 0.032 |
4.955 ± 0.044 | 4.405 ± 0.043 |
6.121 ± 0.046 | 6.698 ± 0.046 |
5.477 ± 0.05 | 6.588 ± 0.041 |
1.198 ± 0.019 | 3.075 ± 0.03 |
Most of the basic statistics you can see at this page can be downloaded from this CSV file
Proteome-pI is available under Creative Commons Attribution-NoDerivs license, for more details see here
| Reference: Kozlowski LP. Proteome-pI 2.0: Proteome Isoelectric Point Database Update. Nucleic Acids Res. 2021, doi: 10.1093/nar/gkab944 | Contact: Lukasz P. Kozlowski |
