Pontibacter sp. 2b14
Taxonomy: cellular organisms; Bacteria; FCB group; Bacteroidetes/Chlorobi group; Bacteroidetes; Cytophagia; Cytophagales; Hymenobacteraceae; Pontibacter; unclassified Pontibacter
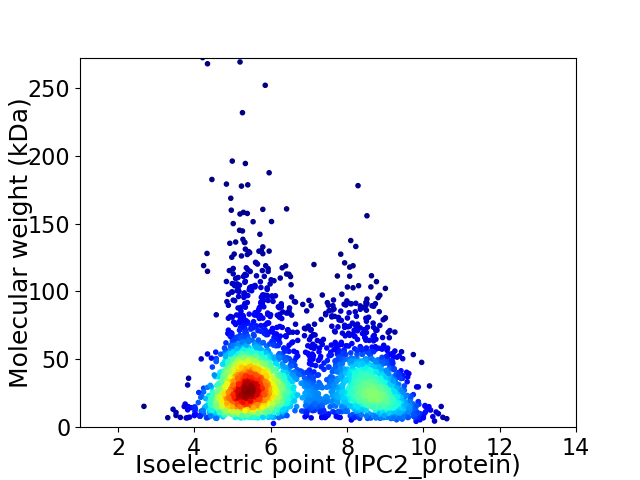
Average proteome isoelectric point is 6.51
Get precalculated fractions of proteins

Virtual 2D-PAGE plot for 3170 proteins (isoelectric point calculated using IPC2_protein)
Get csv file with sequences according to given criteria:
* You can choose from 21 different methods for calculating isoelectric point
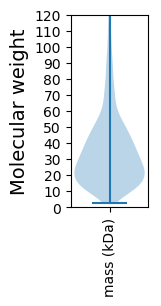
Summary statistics related to proteome-wise predictions


Protein with the lowest isoelectric point:
>tr|A0A364RED8|A0A364RED8_9BACT TPR_REGION domain-containing protein OS=Pontibacter sp. 2b14 OX=2080288 GN=DP923_09705 PE=4 SV=1
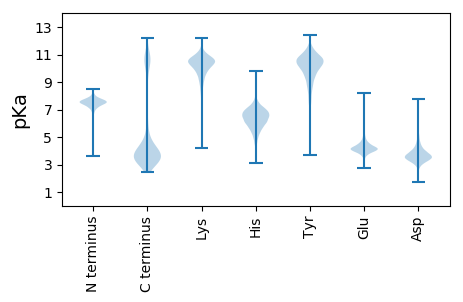
MM1 pKa = 7.56KK2 pKa = 10.52KK3 pKa = 10.27NLFFAAAFMLFAGAAVAQGNTNTVNQSGTNHH34 pKa = 6.04NAEE37 pKa = 4.3VAQTGARR44 pKa = 11.84NYY46 pKa = 10.83SAVDD50 pKa = 3.27QTNDD54 pKa = 3.1NNNAIVDD61 pKa = 3.83QLGTDD66 pKa = 3.34NKK68 pKa = 10.95SEE70 pKa = 3.88IVQIQGAYY78 pKa = 9.78NNEE81 pKa = 3.77ATVDD85 pKa = 3.53QEE87 pKa = 4.37GASNIAYY94 pKa = 8.24QQQGGNATSNVADD107 pKa = 3.74VMQVGDD113 pKa = 4.5NNNALQSQVINSGNNEE129 pKa = 3.78AFIGQFGDD137 pKa = 3.32NNRR140 pKa = 11.84ASQYY144 pKa = 10.73QEE146 pKa = 3.93ASSDD150 pKa = 3.7YY151 pKa = 10.04NLAEE155 pKa = 3.97IVQDD159 pKa = 3.59GTRR162 pKa = 11.84NLANQDD168 pKa = 3.26QSDD171 pKa = 4.03VSGSNQAYY179 pKa = 9.59IDD181 pKa = 3.62QTGDD185 pKa = 3.26RR186 pKa = 11.84NDD188 pKa = 3.6AAQEE192 pKa = 3.9QTNVSLGNMATVTQEE207 pKa = 4.63GYY209 pKa = 9.33WNYY212 pKa = 9.91GFQYY216 pKa = 10.47QRR218 pKa = 11.84GISALNEE225 pKa = 3.67ATITQTGDD233 pKa = 2.77INDD236 pKa = 3.93AYY238 pKa = 10.58QYY240 pKa = 11.15QEE242 pKa = 5.11LISLANVATITQTGDD257 pKa = 2.93YY258 pKa = 10.16NYY260 pKa = 10.82ARR262 pKa = 11.84QEE264 pKa = 3.9QSSLSGLFNEE274 pKa = 4.83ATITQTGDD282 pKa = 3.0SNRR285 pKa = 11.84GFQTQRR291 pKa = 11.84NGGDD295 pKa = 3.16LTATLTQDD303 pKa = 3.21GNSNLSYY310 pKa = 9.39QTQTGTSHH318 pKa = 6.51VSTVTQTGSFNTSTVTQGNN337 pKa = 3.59
MM1 pKa = 7.56KK2 pKa = 10.52KK3 pKa = 10.27NLFFAAAFMLFAGAAVAQGNTNTVNQSGTNHH34 pKa = 6.04NAEE37 pKa = 4.3VAQTGARR44 pKa = 11.84NYY46 pKa = 10.83SAVDD50 pKa = 3.27QTNDD54 pKa = 3.1NNNAIVDD61 pKa = 3.83QLGTDD66 pKa = 3.34NKK68 pKa = 10.95SEE70 pKa = 3.88IVQIQGAYY78 pKa = 9.78NNEE81 pKa = 3.77ATVDD85 pKa = 3.53QEE87 pKa = 4.37GASNIAYY94 pKa = 8.24QQQGGNATSNVADD107 pKa = 3.74VMQVGDD113 pKa = 4.5NNNALQSQVINSGNNEE129 pKa = 3.78AFIGQFGDD137 pKa = 3.32NNRR140 pKa = 11.84ASQYY144 pKa = 10.73QEE146 pKa = 3.93ASSDD150 pKa = 3.7YY151 pKa = 10.04NLAEE155 pKa = 3.97IVQDD159 pKa = 3.59GTRR162 pKa = 11.84NLANQDD168 pKa = 3.26QSDD171 pKa = 4.03VSGSNQAYY179 pKa = 9.59IDD181 pKa = 3.62QTGDD185 pKa = 3.26RR186 pKa = 11.84NDD188 pKa = 3.6AAQEE192 pKa = 3.9QTNVSLGNMATVTQEE207 pKa = 4.63GYY209 pKa = 9.33WNYY212 pKa = 9.91GFQYY216 pKa = 10.47QRR218 pKa = 11.84GISALNEE225 pKa = 3.67ATITQTGDD233 pKa = 2.77INDD236 pKa = 3.93AYY238 pKa = 10.58QYY240 pKa = 11.15QEE242 pKa = 5.11LISLANVATITQTGDD257 pKa = 2.93YY258 pKa = 10.16NYY260 pKa = 10.82ARR262 pKa = 11.84QEE264 pKa = 3.9QSSLSGLFNEE274 pKa = 4.83ATITQTGDD282 pKa = 3.0SNRR285 pKa = 11.84GFQTQRR291 pKa = 11.84NGGDD295 pKa = 3.16LTATLTQDD303 pKa = 3.21GNSNLSYY310 pKa = 9.39QTQTGTSHH318 pKa = 6.51VSTVTQTGSFNTSTVTQGNN337 pKa = 3.59
Molecular weight: 36.06 kDa
Isoelectric point according different methods:
Protein with the highest isoelectric point:
>tr|A0A364RCD9|A0A364RCD9_9BACT FRG domain-containing protein OS=Pontibacter sp. 2b14 OX=2080288 GN=DP923_14775 PE=4 SV=1
MM1 pKa = 7.69LNRR4 pKa = 11.84KK5 pKa = 9.37RR6 pKa = 11.84PLQVTNGLEE15 pKa = 4.26FVVTAVPQQTYY26 pKa = 11.13ANAGLYY32 pKa = 10.21LRR34 pKa = 11.84IVSIGYY40 pKa = 8.47FEE42 pKa = 5.7KK43 pKa = 10.69KK44 pKa = 10.16DD45 pKa = 3.64LPLPCNSAICATILTKK61 pKa = 9.42HH62 pKa = 4.63TRR64 pKa = 11.84FRR66 pKa = 11.84SLHH69 pKa = 5.29FPFRR73 pKa = 11.84VCSSLAPRR81 pKa = 11.84LSQQ84 pKa = 3.95
MM1 pKa = 7.69LNRR4 pKa = 11.84KK5 pKa = 9.37RR6 pKa = 11.84PLQVTNGLEE15 pKa = 4.26FVVTAVPQQTYY26 pKa = 11.13ANAGLYY32 pKa = 10.21LRR34 pKa = 11.84IVSIGYY40 pKa = 8.47FEE42 pKa = 5.7KK43 pKa = 10.69KK44 pKa = 10.16DD45 pKa = 3.64LPLPCNSAICATILTKK61 pKa = 9.42HH62 pKa = 4.63TRR64 pKa = 11.84FRR66 pKa = 11.84SLHH69 pKa = 5.29FPFRR73 pKa = 11.84VCSSLAPRR81 pKa = 11.84LSQQ84 pKa = 3.95
Molecular weight: 9.51 kDa
Isoelectric point according different methods:
Peptides (in silico digests for buttom-up proteomics)
Below you can find in silico digests of the whole proteome with Trypsin, Chymotrypsin, Trypsin+LysC, LysN, ArgC proteases suitable for different mass spec machines.| Try ESI |
 |
|---|
| ChTry ESI |
 |
|---|
| ArgC ESI |
 |
|---|
| LysN ESI |
 |
|---|
| TryLysC ESI |
 |
|---|
| Try MALDI |
 |
|---|
| ChTry MALDI |
 |
|---|
| ArgC MALDI |
 |
|---|
| LysN MALDI |
 |
|---|
| TryLysC MALDI |
 |
|---|
| Try LTQ |
 |
|---|
| ChTry LTQ |
 |
|---|
| ArgC LTQ |
 |
|---|
| LysN LTQ |
 |
|---|
| TryLysC LTQ |
 |
|---|
| Try MSlow |
 |
|---|
| ChTry MSlow |
 |
|---|
| ArgC MSlow |
 |
|---|
| LysN MSlow |
 |
|---|
| TryLysC MSlow |
 |
|---|
| Try MShigh |
 |
|---|
| ChTry MShigh |
 |
|---|
| ArgC MShigh |
 |
|---|
| LysN MShigh |
 |
|---|
| TryLysC MShigh |
 |
|---|
General Statistics
Number of major isoforms |
Number of additional isoforms |
Number of all proteins |
Number of amino acids |
Min. Seq. Length |
Max. Seq. Length |
Avg. Seq. Length |
Avg. Mol. Weight |
|---|---|---|---|---|---|---|---|
0 |
1063188 |
25 |
2614 |
335.4 |
37.49 |
Amino acid frequency
Ala |
Cys |
Asp |
Glu |
Phe |
Gly |
His |
Ile |
Lys |
Leu |
|---|---|---|---|---|---|---|---|---|---|
8.231 ± 0.044 | 0.711 ± 0.012 |
5.059 ± 0.03 | 6.382 ± 0.041 |
4.586 ± 0.036 | 6.77 ± 0.043 |
1.906 ± 0.021 | 6.527 ± 0.043 |
6.375 ± 0.037 | 9.999 ± 0.06 |
Met |
Asn |
Gln |
Pro |
Arg |
Ser |
Thr |
Val |
Trp |
Tyr |
|---|---|---|---|---|---|---|---|---|---|
2.343 ± 0.018 | 5.028 ± 0.039 |
3.974 ± 0.027 | 4.248 ± 0.036 |
4.293 ± 0.031 | 5.963 ± 0.035 |
6.033 ± 0.049 | 6.625 ± 0.029 |
1.022 ± 0.015 | 3.925 ± 0.025 |
Most of the basic statistics you can see at this page can be downloaded from this CSV file
Proteome-pI is available under Creative Commons Attribution-NoDerivs license, for more details see here
| Reference: Kozlowski LP. Proteome-pI 2.0: Proteome Isoelectric Point Database Update. Nucleic Acids Res. 2021, doi: 10.1093/nar/gkab944 | Contact: Lukasz P. Kozlowski |
