Legionella tucsonensis
Taxonomy: cellular organisms; Bacteria; Proteobacteria; Gammaproteobacteria; Legionellales; Legionellaceae; Legionella
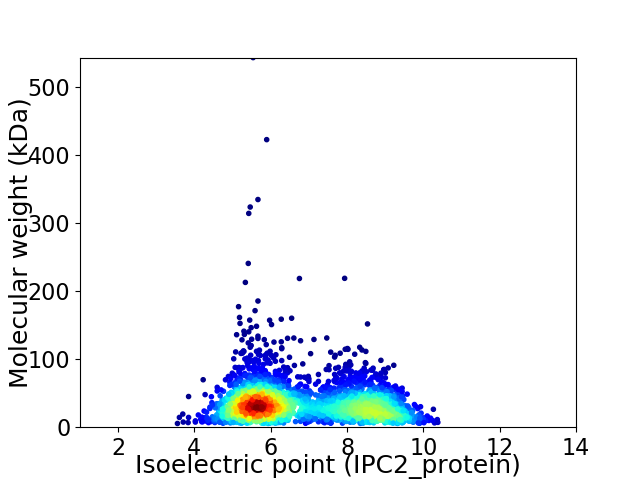
Average proteome isoelectric point is 6.82
Get precalculated fractions of proteins

Virtual 2D-PAGE plot for 2936 proteins (isoelectric point calculated using IPC2_protein)
Get csv file with sequences according to given criteria:
* You can choose from 21 different methods for calculating isoelectric point
Summary statistics related to proteome-wise predictions


Protein with the lowest isoelectric point:
>tr|A0A0W0ZVW2|A0A0W0ZVW2_9GAMM Uncharacterized protein OS=Legionella tucsonensis OX=40335 GN=Ltuc_0807 PE=4 SV=1
MM1 pKa = 7.74IFDD4 pKa = 4.38AALSGLQAATSNLDD18 pKa = 3.51VIGNNIANSSTVGFKK33 pKa = 10.62GSRR36 pKa = 11.84ANFGDD41 pKa = 3.58IYY43 pKa = 11.32AFGGYY48 pKa = 10.18GSFGAGSTSIGSGVMLTQVQQSFASGNLSSSTNSLDD84 pKa = 3.65LAVNGSGFFILNNPGGGAVYY104 pKa = 9.6TRR106 pKa = 11.84AGQFNLNNQNYY117 pKa = 6.59ITNANGQYY125 pKa = 9.31LTGLLSDD132 pKa = 4.04GKK134 pKa = 11.41GNITGTSGKK143 pKa = 9.95LQINTEE149 pKa = 4.26NITPQASTTVTTGVNLNSQSTPPAIDD175 pKa = 3.15WVGGAAPLSSSYY187 pKa = 11.57NNPTSLTIYY196 pKa = 10.51DD197 pKa = 3.93SLGNSHH203 pKa = 6.36VLSMYY208 pKa = 10.4FIKK211 pKa = 10.61ADD213 pKa = 3.32SAAAAGQPNASTPPGTEE230 pKa = 3.85NQWYY234 pKa = 9.58VAFQIDD240 pKa = 4.25NQNVPANAGTDD251 pKa = 3.11NTTNLFEE258 pKa = 5.22VNFNSDD264 pKa = 2.82GSFVGVASPGGAPIGDD280 pKa = 3.71NLIPLSLNLNNGANPLNLNIDD301 pKa = 4.53LSNSTQFGSPFGVQSTSSNGYY322 pKa = 4.73TTGSLASLSIDD333 pKa = 3.31DD334 pKa = 4.18TGLILGIYY342 pKa = 9.84TNGQSMAMGQIQLANFADD360 pKa = 4.04PTGLQNMGNVSWAEE374 pKa = 4.04TSASGQPLIGTAASGGFGAIKK395 pKa = 10.31SGMLEE400 pKa = 3.86QSNVDD405 pKa = 3.72LTSEE409 pKa = 4.03LVDD412 pKa = 5.38LISAQRR418 pKa = 11.84DD419 pKa = 3.74FQANAQSIRR428 pKa = 11.84AGDD431 pKa = 4.32TITQTIINMRR441 pKa = 3.79
MM1 pKa = 7.74IFDD4 pKa = 4.38AALSGLQAATSNLDD18 pKa = 3.51VIGNNIANSSTVGFKK33 pKa = 10.62GSRR36 pKa = 11.84ANFGDD41 pKa = 3.58IYY43 pKa = 11.32AFGGYY48 pKa = 10.18GSFGAGSTSIGSGVMLTQVQQSFASGNLSSSTNSLDD84 pKa = 3.65LAVNGSGFFILNNPGGGAVYY104 pKa = 9.6TRR106 pKa = 11.84AGQFNLNNQNYY117 pKa = 6.59ITNANGQYY125 pKa = 9.31LTGLLSDD132 pKa = 4.04GKK134 pKa = 11.41GNITGTSGKK143 pKa = 9.95LQINTEE149 pKa = 4.26NITPQASTTVTTGVNLNSQSTPPAIDD175 pKa = 3.15WVGGAAPLSSSYY187 pKa = 11.57NNPTSLTIYY196 pKa = 10.51DD197 pKa = 3.93SLGNSHH203 pKa = 6.36VLSMYY208 pKa = 10.4FIKK211 pKa = 10.61ADD213 pKa = 3.32SAAAAGQPNASTPPGTEE230 pKa = 3.85NQWYY234 pKa = 9.58VAFQIDD240 pKa = 4.25NQNVPANAGTDD251 pKa = 3.11NTTNLFEE258 pKa = 5.22VNFNSDD264 pKa = 2.82GSFVGVASPGGAPIGDD280 pKa = 3.71NLIPLSLNLNNGANPLNLNIDD301 pKa = 4.53LSNSTQFGSPFGVQSTSSNGYY322 pKa = 4.73TTGSLASLSIDD333 pKa = 3.31DD334 pKa = 4.18TGLILGIYY342 pKa = 9.84TNGQSMAMGQIQLANFADD360 pKa = 4.04PTGLQNMGNVSWAEE374 pKa = 4.04TSASGQPLIGTAASGGFGAIKK395 pKa = 10.31SGMLEE400 pKa = 3.86QSNVDD405 pKa = 3.72LTSEE409 pKa = 4.03LVDD412 pKa = 5.38LISAQRR418 pKa = 11.84DD419 pKa = 3.74FQANAQSIRR428 pKa = 11.84AGDD431 pKa = 4.32TITQTIINMRR441 pKa = 3.79
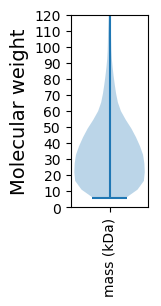
Molecular weight: 45.14 kDa
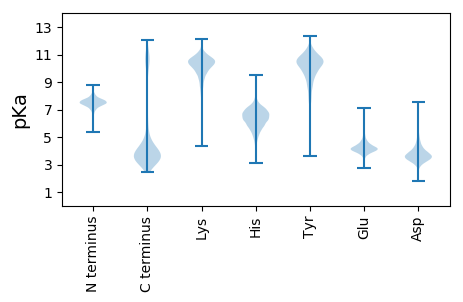
Isoelectric point according different methods:
Protein with the highest isoelectric point:
>tr|A0A0W0ZQJ4|A0A0W0ZQJ4_9GAMM Histidine ammonia lyase OS=Legionella tucsonensis OX=40335 GN=Ltuc_2647 PE=4 SV=1
MM1 pKa = 7.67AEE3 pKa = 3.9VKK5 pKa = 10.18QYY7 pKa = 11.26YY8 pKa = 7.84GTGRR12 pKa = 11.84RR13 pKa = 11.84KK14 pKa = 10.28SSTARR19 pKa = 11.84VFLRR23 pKa = 11.84PGKK26 pKa = 10.95GEE28 pKa = 3.68IKK30 pKa = 10.85VNGRR34 pKa = 11.84TLQEE38 pKa = 4.03YY39 pKa = 9.14FCRR42 pKa = 11.84EE43 pKa = 4.03TSCMVVMQPLEE54 pKa = 4.23TVDD57 pKa = 4.21LVNKK61 pKa = 9.67FDD63 pKa = 3.85VYY65 pKa = 10.13VTVSGGGISGQAGAVRR81 pKa = 11.84LGIARR86 pKa = 11.84ALVAYY91 pKa = 10.12DD92 pKa = 3.55EE93 pKa = 4.77TGLAEE98 pKa = 4.51DD99 pKa = 5.2AEE101 pKa = 4.64PNPNSVRR108 pKa = 11.84RR109 pKa = 11.84RR110 pKa = 11.84LRR112 pKa = 11.84ARR114 pKa = 11.84GLLTRR119 pKa = 11.84DD120 pKa = 2.92SRR122 pKa = 11.84RR123 pKa = 11.84VEE125 pKa = 3.91RR126 pKa = 11.84KK127 pKa = 9.53KK128 pKa = 11.16VGLHH132 pKa = 5.33KK133 pKa = 10.57ARR135 pKa = 11.84RR136 pKa = 11.84ATQYY140 pKa = 10.97SKK142 pKa = 11.25RR143 pKa = 3.79
MM1 pKa = 7.67AEE3 pKa = 3.9VKK5 pKa = 10.18QYY7 pKa = 11.26YY8 pKa = 7.84GTGRR12 pKa = 11.84RR13 pKa = 11.84KK14 pKa = 10.28SSTARR19 pKa = 11.84VFLRR23 pKa = 11.84PGKK26 pKa = 10.95GEE28 pKa = 3.68IKK30 pKa = 10.85VNGRR34 pKa = 11.84TLQEE38 pKa = 4.03YY39 pKa = 9.14FCRR42 pKa = 11.84EE43 pKa = 4.03TSCMVVMQPLEE54 pKa = 4.23TVDD57 pKa = 4.21LVNKK61 pKa = 9.67FDD63 pKa = 3.85VYY65 pKa = 10.13VTVSGGGISGQAGAVRR81 pKa = 11.84LGIARR86 pKa = 11.84ALVAYY91 pKa = 10.12DD92 pKa = 3.55EE93 pKa = 4.77TGLAEE98 pKa = 4.51DD99 pKa = 5.2AEE101 pKa = 4.64PNPNSVRR108 pKa = 11.84RR109 pKa = 11.84RR110 pKa = 11.84LRR112 pKa = 11.84ARR114 pKa = 11.84GLLTRR119 pKa = 11.84DD120 pKa = 2.92SRR122 pKa = 11.84RR123 pKa = 11.84VEE125 pKa = 3.91RR126 pKa = 11.84KK127 pKa = 9.53KK128 pKa = 11.16VGLHH132 pKa = 5.33KK133 pKa = 10.57ARR135 pKa = 11.84RR136 pKa = 11.84ATQYY140 pKa = 10.97SKK142 pKa = 11.25RR143 pKa = 3.79
Molecular weight: 16.01 kDa
Isoelectric point according different methods:
Peptides (in silico digests for buttom-up proteomics)
Below you can find in silico digests of the whole proteome with Trypsin, Chymotrypsin, Trypsin+LysC, LysN, ArgC proteases suitable for different mass spec machines.| Try ESI |
 |
|---|
| ChTry ESI |
 |
|---|
| ArgC ESI |
 |
|---|
| LysN ESI |
 |
|---|
| TryLysC ESI |
 |
|---|
| Try MALDI |
 |
|---|
| ChTry MALDI |
 |
|---|
| ArgC MALDI |
 |
|---|
| LysN MALDI |
 |
|---|
| TryLysC MALDI |
 |
|---|
| Try LTQ |
 |
|---|
| ChTry LTQ |
 |
|---|
| ArgC LTQ |
 |
|---|
| LysN LTQ |
 |
|---|
| TryLysC LTQ |
 |
|---|
| Try MSlow |
 |
|---|
| ChTry MSlow |
 |
|---|
| ArgC MSlow |
 |
|---|
| LysN MSlow |
 |
|---|
| TryLysC MSlow |
 |
|---|
| Try MShigh |
 |
|---|
| ChTry MShigh |
 |
|---|
| ArgC MShigh |
 |
|---|
| LysN MShigh |
 |
|---|
| TryLysC MShigh |
 |
|---|
General Statistics
Number of major isoforms |
Number of additional isoforms |
Number of all proteins |
Number of amino acids |
Min. Seq. Length |
Max. Seq. Length |
Avg. Seq. Length |
Avg. Mol. Weight |
|---|---|---|---|---|---|---|---|
0 |
972462 |
50 |
4865 |
331.2 |
37.27 |
Amino acid frequency
Ala |
Cys |
Asp |
Glu |
Phe |
Gly |
His |
Ile |
Lys |
Leu |
|---|---|---|---|---|---|---|---|---|---|
7.449 ± 0.047 | 1.186 ± 0.016 |
4.712 ± 0.032 | 6.09 ± 0.05 |
4.602 ± 0.036 | 5.937 ± 0.045 |
2.578 ± 0.022 | 7.587 ± 0.041 |
6.46 ± 0.051 | 10.987 ± 0.047 |
Met |
Asn |
Gln |
Pro |
Arg |
Ser |
Thr |
Val |
Trp |
Tyr |
|---|---|---|---|---|---|---|---|---|---|
2.402 ± 0.02 | 4.884 ± 0.031 |
4.09 ± 0.029 | 4.546 ± 0.033 |
4.119 ± 0.03 | 6.552 ± 0.031 |
5.273 ± 0.029 | 5.917 ± 0.04 |
1.129 ± 0.02 | 3.498 ± 0.028 |
Most of the basic statistics you can see at this page can be downloaded from this CSV file
Proteome-pI is available under Creative Commons Attribution-NoDerivs license, for more details see here
| Reference: Kozlowski LP. Proteome-pI 2.0: Proteome Isoelectric Point Database Update. Nucleic Acids Res. 2021, doi: 10.1093/nar/gkab944 | Contact: Lukasz P. Kozlowski |
