Hubei macula-like virus 1
Taxonomy: Viruses; Riboviria; unclassified Riboviria; unclassified RNA viruses ShiM-2016
Average proteome isoelectric point is 7.46
Get precalculated fractions of proteins

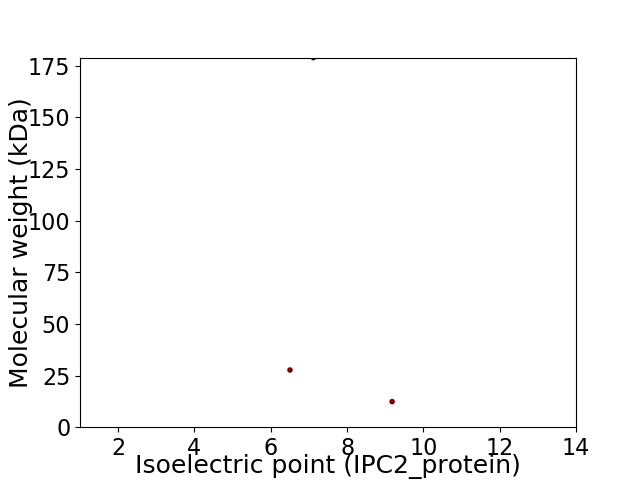
Virtual 2D-PAGE plot for 3 proteins (isoelectric point calculated using IPC2_protein)
Get csv file with sequences according to given criteria:
* You can choose from 21 different methods for calculating isoelectric point
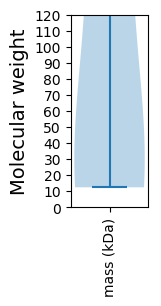
Summary statistics related to proteome-wise predictions


Protein with the lowest isoelectric point:
>tr|A0A1L3KK41|A0A1L3KK41_9VIRU Tymo_coat domain-containing protein OS=Hubei macula-like virus 1 OX=1922922 PE=4 SV=1
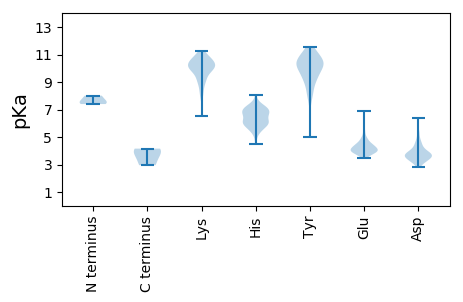
MM1 pKa = 8.01DD2 pKa = 3.43AHH4 pKa = 6.01EE5 pKa = 4.38TLFVSSKK12 pKa = 9.22TKK14 pKa = 10.07SSSRR18 pKa = 11.84GLIAHH23 pKa = 6.86NFQSINHH30 pKa = 5.78NPRR33 pKa = 11.84LIMDD37 pKa = 3.72QLILLLKK44 pKa = 10.19PLLDD48 pKa = 3.8KK49 pKa = 11.2LLLPSEE55 pKa = 4.45EE56 pKa = 4.08AATPEE61 pKa = 4.25VSPPPPSIAPPKK73 pKa = 10.69APALSNNPVLPALPVPRR90 pKa = 11.84FSGHH94 pKa = 7.12LPQTAGNQGVLIPFQVSVFHH114 pKa = 6.98INAASDD120 pKa = 3.57SASSYY125 pKa = 9.5TIRR128 pKa = 11.84EE129 pKa = 3.98LSAVQTLLPYY139 pKa = 10.5FRR141 pKa = 11.84DD142 pKa = 3.82VVVKK146 pKa = 10.35QADD149 pKa = 3.74VVVFPTVASKK159 pKa = 8.7TVPASIDD166 pKa = 3.76LCWSPSYY173 pKa = 10.47KK174 pKa = 10.05ILGSEE179 pKa = 4.33VLSTPSSTRR188 pKa = 11.84FNIGLDD194 pKa = 3.38PALISSSLPCDD205 pKa = 3.95FGHH208 pKa = 7.01INPIIKK214 pKa = 10.41SPIPYY219 pKa = 9.38DD220 pKa = 3.22DD221 pKa = 4.37HH222 pKa = 6.79PRR224 pKa = 11.84LNIKK228 pKa = 9.87IYY230 pKa = 9.7QSSGASSSVPLGEE243 pKa = 4.45LIIRR247 pKa = 11.84GILQCSNPLPNN258 pKa = 4.16
MM1 pKa = 8.01DD2 pKa = 3.43AHH4 pKa = 6.01EE5 pKa = 4.38TLFVSSKK12 pKa = 9.22TKK14 pKa = 10.07SSSRR18 pKa = 11.84GLIAHH23 pKa = 6.86NFQSINHH30 pKa = 5.78NPRR33 pKa = 11.84LIMDD37 pKa = 3.72QLILLLKK44 pKa = 10.19PLLDD48 pKa = 3.8KK49 pKa = 11.2LLLPSEE55 pKa = 4.45EE56 pKa = 4.08AATPEE61 pKa = 4.25VSPPPPSIAPPKK73 pKa = 10.69APALSNNPVLPALPVPRR90 pKa = 11.84FSGHH94 pKa = 7.12LPQTAGNQGVLIPFQVSVFHH114 pKa = 6.98INAASDD120 pKa = 3.57SASSYY125 pKa = 9.5TIRR128 pKa = 11.84EE129 pKa = 3.98LSAVQTLLPYY139 pKa = 10.5FRR141 pKa = 11.84DD142 pKa = 3.82VVVKK146 pKa = 10.35QADD149 pKa = 3.74VVVFPTVASKK159 pKa = 8.7TVPASIDD166 pKa = 3.76LCWSPSYY173 pKa = 10.47KK174 pKa = 10.05ILGSEE179 pKa = 4.33VLSTPSSTRR188 pKa = 11.84FNIGLDD194 pKa = 3.38PALISSSLPCDD205 pKa = 3.95FGHH208 pKa = 7.01INPIIKK214 pKa = 10.41SPIPYY219 pKa = 9.38DD220 pKa = 3.22DD221 pKa = 4.37HH222 pKa = 6.79PRR224 pKa = 11.84LNIKK228 pKa = 9.87IYY230 pKa = 9.7QSSGASSSVPLGEE243 pKa = 4.45LIIRR247 pKa = 11.84GILQCSNPLPNN258 pKa = 4.16
Molecular weight: 27.69 kDa
Isoelectric point according different methods:
Protein with the highest isoelectric point:
>tr|A0A1L3KK41|A0A1L3KK41_9VIRU Tymo_coat domain-containing protein OS=Hubei macula-like virus 1 OX=1922922 PE=4 SV=1
MM1 pKa = 7.57APSTMQRR8 pKa = 11.84YY9 pKa = 8.38LQILATDD16 pKa = 3.77AMAFSSQRR24 pKa = 11.84KK25 pKa = 6.52VVVYY29 pKa = 8.4VWVYY33 pKa = 8.16PSQRR37 pKa = 11.84KK38 pKa = 7.98FFPSRR43 pKa = 11.84HH44 pKa = 5.92PIIDD48 pKa = 3.59RR49 pKa = 11.84GRR51 pKa = 11.84VIYY54 pKa = 10.64SDD56 pKa = 3.53AVRR59 pKa = 11.84ALLLDD64 pKa = 3.69NVFQTLLSPQSTTSDD79 pKa = 2.81IATLATSLGASLDD92 pKa = 3.61DD93 pKa = 3.6VGIFFSFSCSFSPVPRR109 pKa = 11.84KK110 pKa = 9.82SS111 pKa = 2.95
MM1 pKa = 7.57APSTMQRR8 pKa = 11.84YY9 pKa = 8.38LQILATDD16 pKa = 3.77AMAFSSQRR24 pKa = 11.84KK25 pKa = 6.52VVVYY29 pKa = 8.4VWVYY33 pKa = 8.16PSQRR37 pKa = 11.84KK38 pKa = 7.98FFPSRR43 pKa = 11.84HH44 pKa = 5.92PIIDD48 pKa = 3.59RR49 pKa = 11.84GRR51 pKa = 11.84VIYY54 pKa = 10.64SDD56 pKa = 3.53AVRR59 pKa = 11.84ALLLDD64 pKa = 3.69NVFQTLLSPQSTTSDD79 pKa = 2.81IATLATSLGASLDD92 pKa = 3.61DD93 pKa = 3.6VGIFFSFSCSFSPVPRR109 pKa = 11.84KK110 pKa = 9.82SS111 pKa = 2.95
Molecular weight: 12.38 kDa
Isoelectric point according different methods:
Peptides (in silico digests for buttom-up proteomics)
Below you can find in silico digests of the whole proteome with Trypsin, Chymotrypsin, Trypsin+LysC, LysN, ArgC proteases suitable for different mass spec machines.| Try ESI |
 |
|---|
| ChTry ESI |
 |
|---|
| ArgC ESI |
 |
|---|
| LysN ESI |
 |
|---|
| TryLysC ESI |
 |
|---|
| Try MALDI |
 |
|---|
| ChTry MALDI |
 |
|---|
| ArgC MALDI |
 |
|---|
| LysN MALDI |
 |
|---|
| TryLysC MALDI |
 |
|---|
| Try LTQ |
 |
|---|
| ChTry LTQ |
 |
|---|
| ArgC LTQ |
 |
|---|
| LysN LTQ |
 |
|---|
| TryLysC LTQ |
 |
|---|
| Try MSlow |
 |
|---|
| ChTry MSlow |
 |
|---|
| ArgC MSlow |
 |
|---|
| LysN MSlow |
 |
|---|
| TryLysC MSlow |
 |
|---|
| Try MShigh |
 |
|---|
| ChTry MShigh |
 |
|---|
| ArgC MShigh |
 |
|---|
| LysN MShigh |
 |
|---|
| TryLysC MShigh |
 |
|---|
General Statistics
Number of major isoforms |
Number of additional isoforms |
Number of all proteins |
Number of amino acids |
Min. Seq. Length |
Max. Seq. Length |
Avg. Seq. Length |
Avg. Mol. Weight |
|---|---|---|---|---|---|---|---|
0 |
1947 |
111 |
1578 |
649.0 |
73.01 |
Amino acid frequency
Ala |
Cys |
Asp |
Glu |
Phe |
Gly |
His |
Ile |
Lys |
Leu |
|---|---|---|---|---|---|---|---|---|---|
7.653 ± 0.194 | 1.387 ± 0.147 |
5.085 ± 0.238 | 3.955 ± 1.031 |
5.085 ± 0.452 | 3.595 ± 0.135 |
3.903 ± 0.853 | 5.65 ± 0.821 |
4.109 ± 0.312 | 11.402 ± 0.365 |
Met |
Asn |
Gln |
Pro |
Arg |
Ser |
Thr |
Val |
Trp |
Tyr |
|---|---|---|---|---|---|---|---|---|---|
1.489 ± 0.217 | 4.366 ± 0.59 |
7.756 ± 1.312 | 4.109 ± 0.21 |
5.29 ± 0.614 | 9.656 ± 1.967 |
5.085 ± 0.337 | 5.65 ± 0.953 |
1.079 ± 0.255 | 3.698 ± 0.608 |
Most of the basic statistics you can see at this page can be downloaded from this CSV file
Proteome-pI is available under Creative Commons Attribution-NoDerivs license, for more details see here
| Reference: Kozlowski LP. Proteome-pI 2.0: Proteome Isoelectric Point Database Update. Nucleic Acids Res. 2021, doi: 10.1093/nar/gkab944 | Contact: Lukasz P. Kozlowski |
